What happens after the stock market hits record highs? History, corrections and what investors may want to consider

Editorial Staff, J.P. Morgan Wealth Management
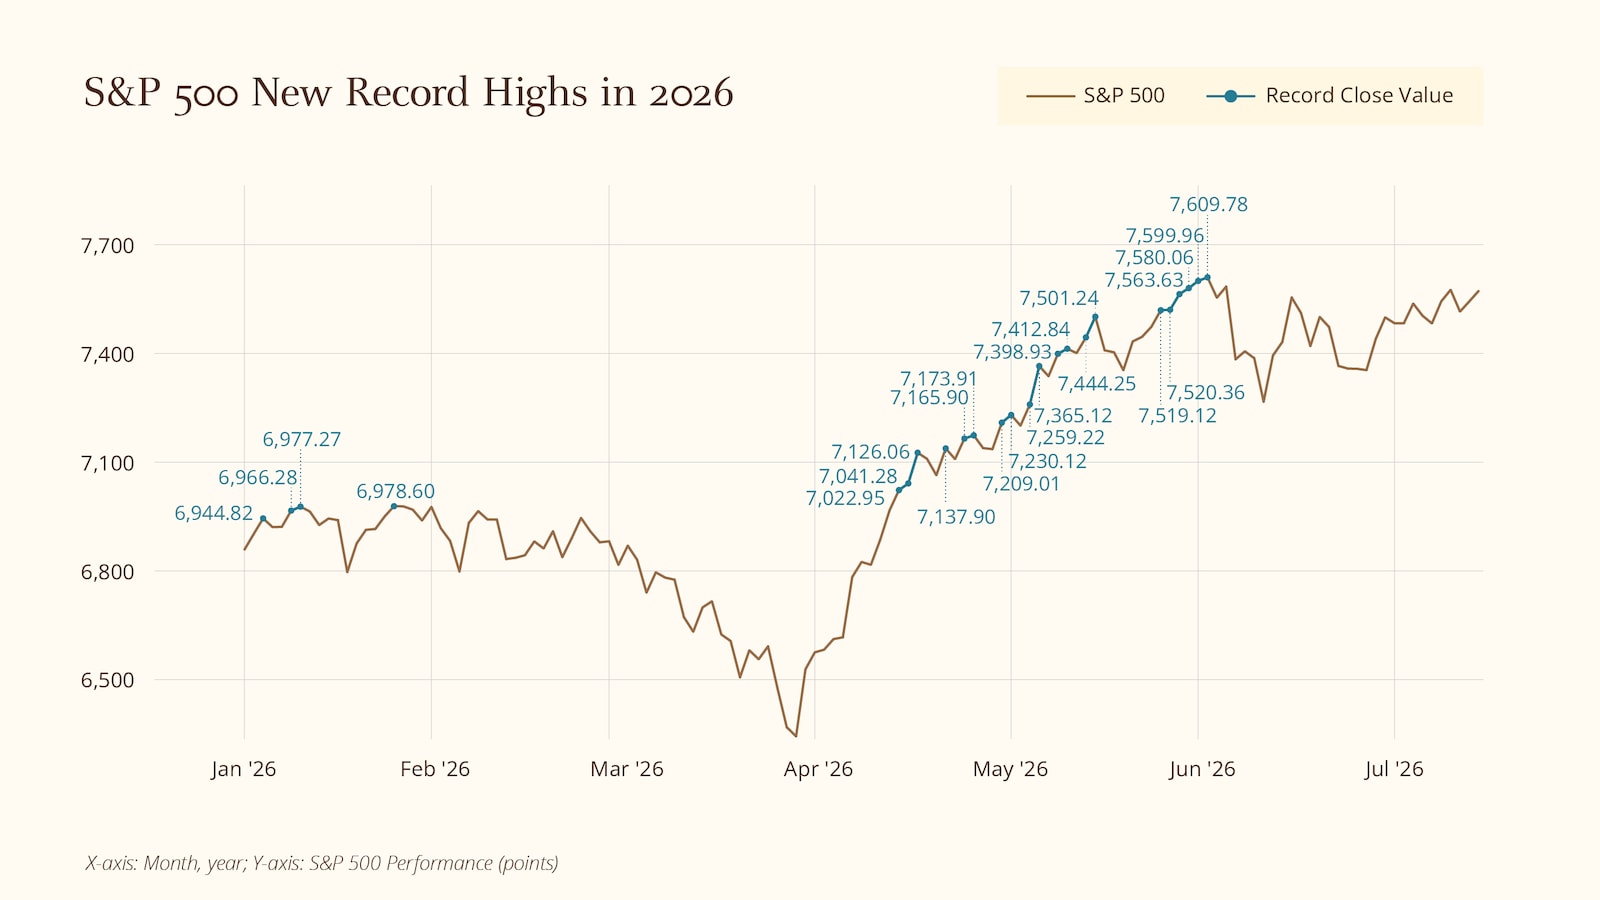
- The S&P 500 has logged 24 new record highs in 2026, the most recent of which came on June 2, when the index closed at 7,609 points.
- All-time highs aren’t rare in a market that tends to rise over time, and a record high by itself isn’t a signal to sell.
- Historically, short-term returns following record highs have been mixed, but returns over longer horizons have been positive more often than not.
- Pullbacks are a normal part of investing: Markets can hit new highs and still experience routine declines, including corrections and sometimes bear markets.
- Trying to wait for the “perfect” entry point can backfire by creating timing risk and cash drag. Strategies like dollar-cost averaging, automatic contributions and rebalancing can help investors stay focused on their long-term goals.

When the stock market hits a new record high, sometimes it can feel like a warning sign – as if the next move must be down. But an “all-time high” is simply a new peak for an index such as the S&P 500; and in a market that tends to rise over time, new highs are a normal part of the journey.
An all-time high can mean two different things: an intraday high – when an index briefly trades above its previous peak – or a record close – when it finishes the day at a new high. Either way, records aren’t necessarily rare. In markets that tend to rise over time, compounding means gains build on gains. Over longer periods, corporate earnings growth has historically been a core driver of higher stock prices. It also helps to remember that company sales and profits are reported in dollars. As inflation increases prices over time, companies often take in more dollars in revenue and earnings. And because indexes track those companies, index levels can rise as well.
It's also worth remembering that the S&P 500 isn’t a fixed set of companies. Its membership has changed over time as the economy has evolved, so the index’s price tag today can create sticker shock in isolation. Ultimately, it’s a benchmark for broad U.S. large-cap performance and is driven by the underlying earnings power and growth potential of its constituents.
And while markets can move for many reasons, they tend to look ahead – shifting as new information changes expectations about growth and risk. Economic reports, interest-rate expectations, company updates and headlines can all influence what investors think businesses may earn in the future. Because the market includes many participants with different goals and time horizons, prices can adjust quickly as those views change.
In that context, earnings expectations matter because they help shape what investors are willing to pay today. If current forecasts hold, this would mark the seventh consecutive quarter of double-digit earnings-per-share (EPS) growth – the longest streak since the years following the global financial crisis. Even so, markets don’t wait for earnings to be “official” – they adjust as expectations change, which is why the next move after a record high isn’t predictable.
The catch is that a record-high headline doesn’t tell you what comes next. New highs can arrive right before a routine pullback, or they can cluster during long stretches of gains. That uncertainty is exactly what makes waiting for the “perfect” dip so tempting. In this article, we’ll explain what an all-time high really means, what market history has often revealed in the months following a peak, and why waiting for the “perfect” dip may introduce both timing risk and cash drag.
The S&P 500 has hit 24 new record highs so far this year
Past performance is no guarantee of future results. It is not possible to invest directly in an index.
Are all-time highs a sell signal? What history suggests (and what it doesn’t)
A record high alone is not a proven sell signal, as outcomes often vary and timing the top of the market is difficult. Historical market patterns can offer some insight, but they should be used to describe probabilities rather than make predictions. Plus, results vary depending on the time window measured (weeks versus years).
What’s more, if you were to sell after a record high, chances are you would miss out on further gains. For example, when the S&P 500 hit a new record high on May 26 of 7,519 points, investors who sold holdings would’ve missed out on more gains. The index continued to hit new record highs in the following five trading sessions, eventually rising to 7,609 points by early June – a gain of 1.2% that would have been left on the table.
Still, continued market highs are not guaranteed. For instance, as of July 24, the S&P 500 had fallen to 7,412 points, or roughly 2.6% from its record high in early June. This shows that even if you stay invested over the long-term, returns are never guaranteed. Depending on your risk tolerance, time horizon and long-term strategy, taking profits can also be an appropriate strategy in some cases.
What has happened after record highs? Market returns in the months and years that follow
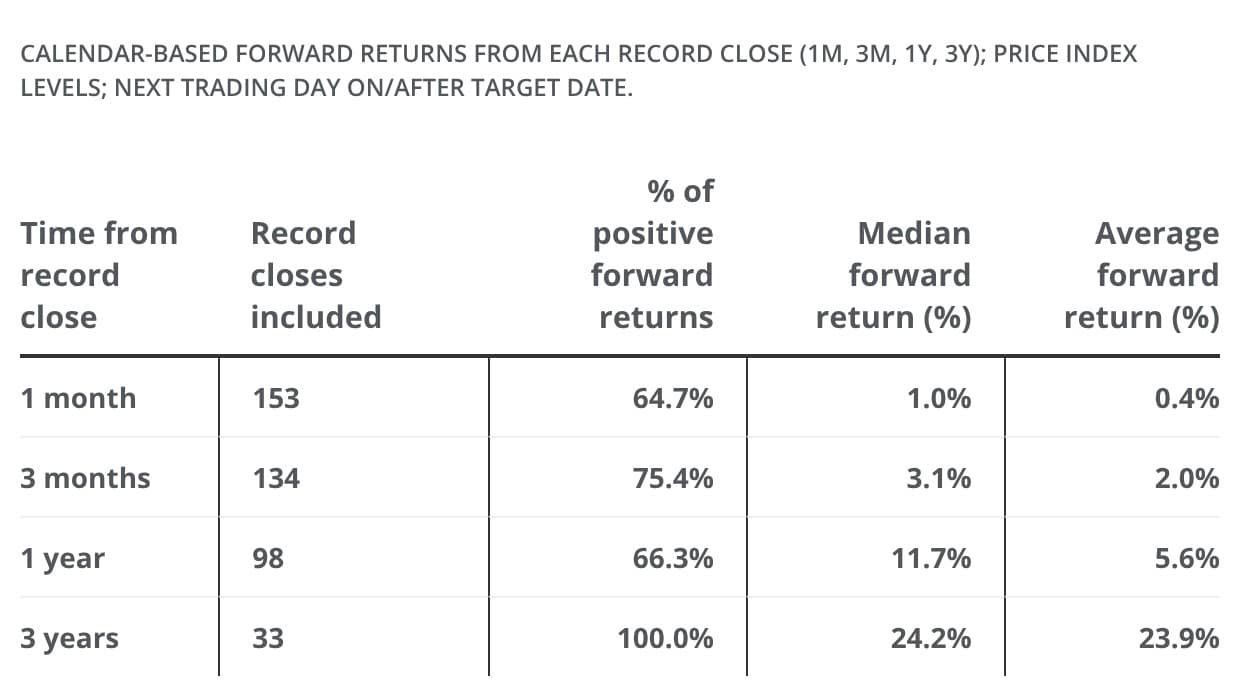
Markets don’t reliably “top out” just because they hit a record. Using S&P 500 price return data from July 15, 2021, to July 15, 2026, the following chart displays returns after a new all-time-high close at intervals of one month, three months, one year and three years, where applicable. Forward returns are measured from each record close to the S&P 500 level on the same calendar date months or years later, using the next available trading day when markets are closed.
All-time highs may beget more all-time highs
Past performance is no guarantee of future results. It is not possible to invest directly in an index.
The short-term picture was mixed, with outcomes ranging from gains to pullbacks. But over longer time horizons, returns were more often positive, reflecting how markets may rise over time despite periodic corrections. The takeaway: A record high can feel like a warning sign, but historically it hasn’t been a dependable reason to sell or stop investing by itself.
Get up to $1,000
When you open a J.P. Morgan Self-Directed Investing account, you get a trading experience that puts you in control and up to $1,000 in cash bonus.
How common are pullbacks after record highs? Understanding corrections vs. bear markets
Record highs can make investors feel like a drop is due. But pullbacks are a normal feature of the stock market, not an exception – and they can happen at any time, including during long-term bull markets. According to our investment strategists, the S&P 500 has experienced an average intrayear pullback of about 14% over the past four decades, and 14 of those 40 years saw even steeper intrayear declines. Yet the full-year return was positive in 31 of 40 years (78% of the time) – a good reminder that short-term volatility and long-term compounding can coexist.
It may help to review the different types of pullbacks that can occur:
- A correction is commonly defined as a decline of about 10% from a recent peak in a broad market index (such as the S&P 500).
- A bear market is commonly defined as a decline of about 20% from a recent peak.
- You’ll also hear the term sell-off, which is a more general label for a sharp decline over a shorter period.
These labels matter because they help put headlines in context. A market that’s capable of reaching new highs is also capable of pulling back. Volatility like this is often the price of admission for long-term stock investing. That doesn’t mean risk is trivial or that declines can’t be painful. It means volatility is part of how markets work, and it can feel especially intense if your time horizon is short or you’re overly concentrated in a single investment.
Even in good long-term markets, downturns and recoveries are normal, and they don’t always follow a neat script. Corrections happen regularly. New highs can cluster during strong runs and pullbacks can show up without warning. The headline matters less than your plan, your time horizon and how much risk you can tolerate.
The risk of waiting for a pullback: Timing risk and the hidden cost of sitting in cash
Waiting for a pullback may sound like a cautious move for buyers: Why buy after an index hits a record high when you might get a better price later? The challenge is that markets don’t move on a schedule. Stocks can keep rising for longer than many investors expect, and a pullback may arrive only after additional gains that you missed. Waiting can ultimately have two costs: missing additional gains and holding cash that may lose purchasing power to inflation.
That’s the core of timing risk. To come out ahead, you must be right twice – when stepping aside and when getting back in. And even investors who make the first call correctly can struggle with the second one. A drop that finally arrives can feel scary, making it tempting to wait for markets to move just a little lower – while the market rebounds without you. It’s one reason the saying “time in the market matters more than timing the market” may resonate with long-term investors.
There’s also a quieter downside to sitting on the sidelines – cash drag. Money held in cash or cash-like accounts may feel stable from day to day, but it can lose purchasing power over time as prices rise. And over long periods, cash has often lagged the growth potential of diversified stock investments, which means the cost of waiting isn’t only the risk of buying at a higher price later, but also the opportunity cost of not participating in market growth.
A concrete way to visualize this is to consider what happens when an investor misses a small number of the market’s strongest days. Those good days often cluster around volatile periods, which can make them hard to predict or capture if you’re moving in and out. In fact, J.P. Morgan Wealth Management investment strategists found that between June 2006 and June 2026, seven of the 10 best days for the S&P 500 occurred within 15 days of the 10 worst days. That matters because fear can push investors out of the market during volatility – only to see them miss the rebound that can follow soon after.
Strategies for investors to consider
If record highs make you uneasy, the goal doesn’t have to be predicting what happens next. Rather, it can be choosing an approach you can stick with through headlines and volatility.
One option is dollar-cost averaging, where you invest a set amount on a regular schedule. This approach may help reduce the pressure of deciding when to invest your money, because you’re spreading purchases across many market levels over time. A related approach is setting up automatic contributions (such as recurring transfers to an investment account), which can help turn investing into a habit instead of a reaction to market news.
Another common tool is rebalancing. If you have a target mix of stocks, bonds and cash, rebalancing is the process of periodically adjusting back to that target. In practice, that can mean trimming positions that have grown to a larger share of your portfolio and adding to areas that have lagged – a rules-based way to manage risk that doesn’t rely on calling tops or bottoms.
Time horizon and diversification can also change the range of outcomes. While stock returns in any single calendar year have widely varied since 1950 (from +60% to -41%), over longer periods the range has tended to narrow, especially in diversified portfolios. J.P. Morgan Wealth Management strategists analyzed monthly returns of the standard 60/40 portfolio (60% equities and 40% fixed income) over the past 70 years, and found that this blend of stocks and bonds has suffered only about a -1% annualized negative return over any five-year rolling period. This demonstrates how staying invested, being diversified and maintaining a long-term mindset may help to reduce volatility.
Before acting on a record-high headline, it can help to use a simple decision lens:
- Time horizon: When will you need the money? Short-term goals generally have less room for volatility than long-term goals.
- Emergency savings: Do you have cash set aside for unexpected expenses, separate from investments?
- Risk tolerance: Can you stay invested through pullbacks without abandoning your plan?
The bottom line
All-time highs aren’t rare in a market that tends to rise over time, and a record high by itself isn’t a sell signal. History suggests stocks have often gone on to post additional gains after setting new highs – even as pullbacks and corrections remain a normal part of the ride. The bigger risk for many long-term investors isn’t that the market is at a high, but that waiting for the perfect pullback can create timing risk and cash drag.
A more durable next step may be to focus on what you can control: Clarify your goals and time horizon, make sure your mix of investments matches your risk tolerance, and consider automating contributions or using a consistent schedule so you’re not making decisions based on headlines. Then revisit the plan during volatile stretches with the same discipline you’d apply during strong runs.
Frequently asked questions about stock market all-time highs
Not necessarily. New record highs may be common over long periods, and a new high alone isn’t a reliable signal of a looming market drop. What matters most is your time horizon and whether your portfolio matches your risk tolerance.
Not always. Short-term results after record highs can be mixed, but over longer time frames, history suggests that all-time highs tend to beget more all-time highs (though highs and returns are never guaranteed).
Investors may want to consider spreading investments over time with methods such as dollar-cost averaging, or by setting up automatic contributions, rather than trying to time the market. You may also want to review your target allocation and rebalance your portfolio so your risk level stays in line with your financial plan.
You're invited to subscribe to our newsletters
We'll send you the latest market news, investing insights and more when you subscribe to our newsletters.