
Sell in May and go away? Why there’s no ‘best’ time to get invested

Global Investment Strategist
- “Sell in May and go away” is a market adage suggesting stocks tend to underperform during the summer months (May to October) compared with the winter (November to April).
- Since 2015, the S&P 500 has delivered nearly identical price returns, on average, between May and October and between November and April, but outcomes vary widely year to year.
- Instead of making a calendar-based decision, focus on what you can control: Stay invested when it fits your goals, keep an appropriate cash buffer, rebalance your portfolio when needed and consider a systematic, phase-in approach for new money.

The phrase “sell in May and go away” describes market seasonality, suggesting investors may want to consider reducing market exposure in late spring and then return to it in late fall (like November). The saying is based on the idea that equity returns have historically been weaker in the May-October period compared with November-April.
This year, the temptation to follow that playbook might feel particularly strong. As of the start of June, the S&P 500 has already recorded 24 all-time highs in 2026 (and 11 in May alone). Against a backdrop of elevated inflation, combined with ongoing geopolitical conflict and record equity levels, the idea of stepping to the side could appeal to some investors. Recent history, however, suggests doing so may not be the best move.
Instead of attempting to time the market, a more reliable approach is often to stay disciplined, remain invested and focus on your long-term plan.
How does the stock market typically perform in the summer?
Some investors point to structural reasons as to why markets may appear weaker during the summer. For example, trading volumes may decline as market participants step away for summer vacations, earnings releases tend to be less concentrated and fewer major economic catalysts can lead to perceptions of slowing momentum. Taken together, this environment can feel less supportive for equities.
So, while the logic behind “sell in May and go away” may seem reasonable, seasonal patterns over the past decade have been far less consistent than the phrase suggests. Since 2015, the S&P 500 has delivered nearly identical price returns when comparing average price returns between May-October (+5.64%) and November-April (+5.71%).
The variability within these periods is also important to consider. Summer months over the past decade have not consistently produced negative outcomes. Instead, June and July combined have, on average, seen just one month of negative S&P 500 performance. Again, the idea of seasonal patterns might feel intuitive, but recent data suggests the “sell in May” adage just doesn’t hold up. Real-world experiences aren’t tied to the calendar, as strong returns, drawdowns and sharp reversals can occur at any point during the year.
Get up to $1,000
When you open a J.P. Morgan Self-Directed Investing account, you get a trading experience that puts you in control and up to $1,000 in cash bonus.
If the calendar is not a reliable guide, what should investors focus on instead?
For those with long-term goals, staying invested remains one of the most consistent drivers of success. Since the early 2000s, the S&P 500 has never delivered a negative annualized return over any 11-year holding period. This is a reminder that time horizon – not timing – has historically been the more important factor.
Time in market beats timing the market
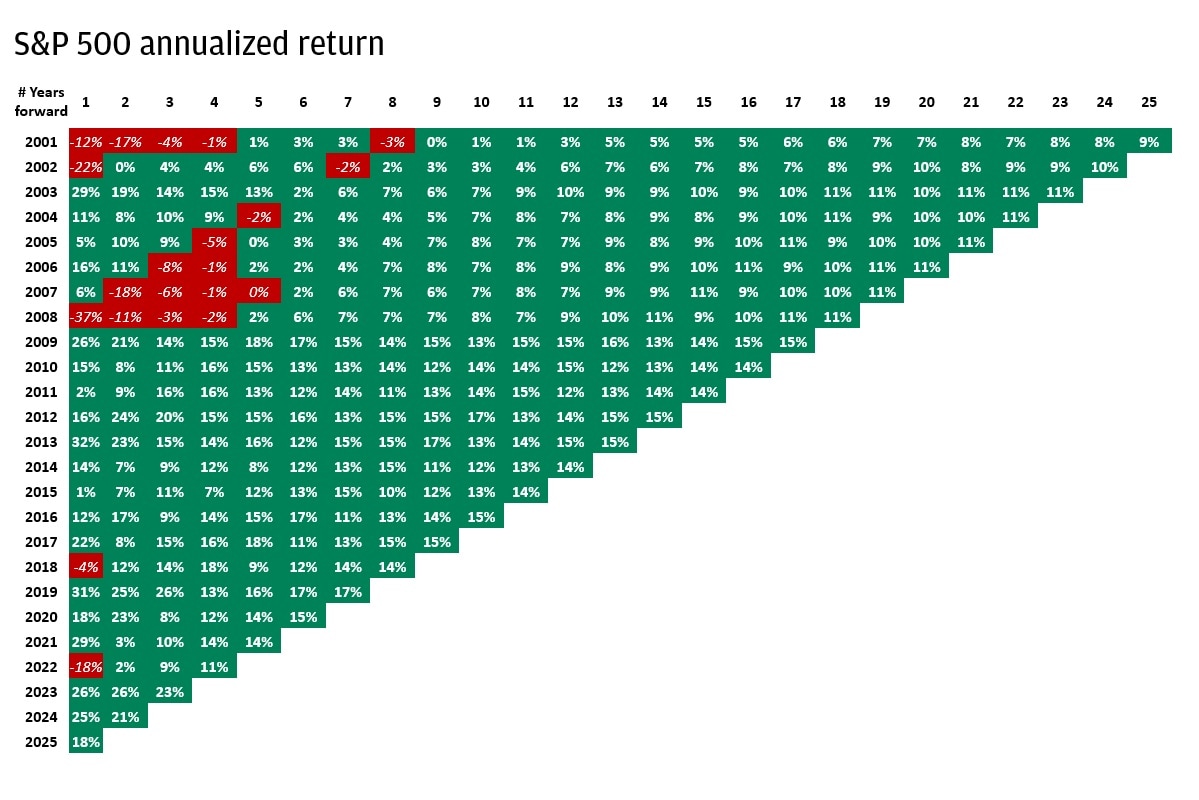
Some key data points to consider here include the following:
- Short-term returns (one to three years) can be highly volatile, with some years showing significant negative returns. For example, the one-year return starting in 2008 was -37%, and the one-year return starting in 2002 was -22%.
- As the holding period increases, annualized returns become more stable and positive. For example, the 10-year annualized return starting in 2009 was 13%, and the 20-year annualized return starting in 2001 was 7%.
- Over longer periods (10 years or more), the S&P 500 has consistently delivered positive annualized returns, regardless of the starting year.
- The chart visually demonstrates that staying invested in the market for longer periods (“time in the market”) generally results in more reliable and positive returns than trying to time the market with short-term investments.
The chart highlights the benefit of investing in the S&P 500 for the long term, as extended holding periods tend to smooth out short-term volatility and negative returns.
Periods like the summer months can serve as useful checkpoints rather than triggers for action. Strong performance, such as the rally observed through May 2026, can cause portfolios to drift from their intended allocations. For example, a balanced portfolio that began 2026 at 60% U.S. equities and 40% U.S. bonds may now sit closer to 63% and 37%. Rather than exiting markets entirely, a more disciplined approach could be to rebalance and ensure exposures align with long-term objectives.
It may also be helpful for investors to reframe how they think about market entry points. The presence of all-time highs often creates hesitation; historically, though, investing at these levels hasn’t materially reduced forward returns over longer horizons. The more relevant question could be whether there is confidence in the long-term trajectory of earnings and economic growth.
We believe the current environment continues to support the case for equities for the near-term.
For investors ready to deploy excess capital, a systematic approach for putting new cash to work could help reduce the pressure of trying to identify the “right” entry point. Phasing in investments over time on a consistent schedule can position investors to participate across different market conditions without relying on short-term timing decisions. That is, by spreading out their entry points, investors can potentially smooth future outcomes.
The bottom line
“Sell in May and go away” may be a memorable phrase, but recent history suggests it’s not a sound process. For most long-term investors, the more dependable approach is often to stick to your long-term plan, maintaining appropriate diversification, right-sizing cash positions and investing systematically.
Invest your way
Not working with us yet? Find a J.P. Morgan Advisor or explore ways to invest online.