Stock market returns for 2026: How are the S&P 500, Nasdaq and Dow performing so far?

Editorial staff, J.P. Morgan Wealth Management
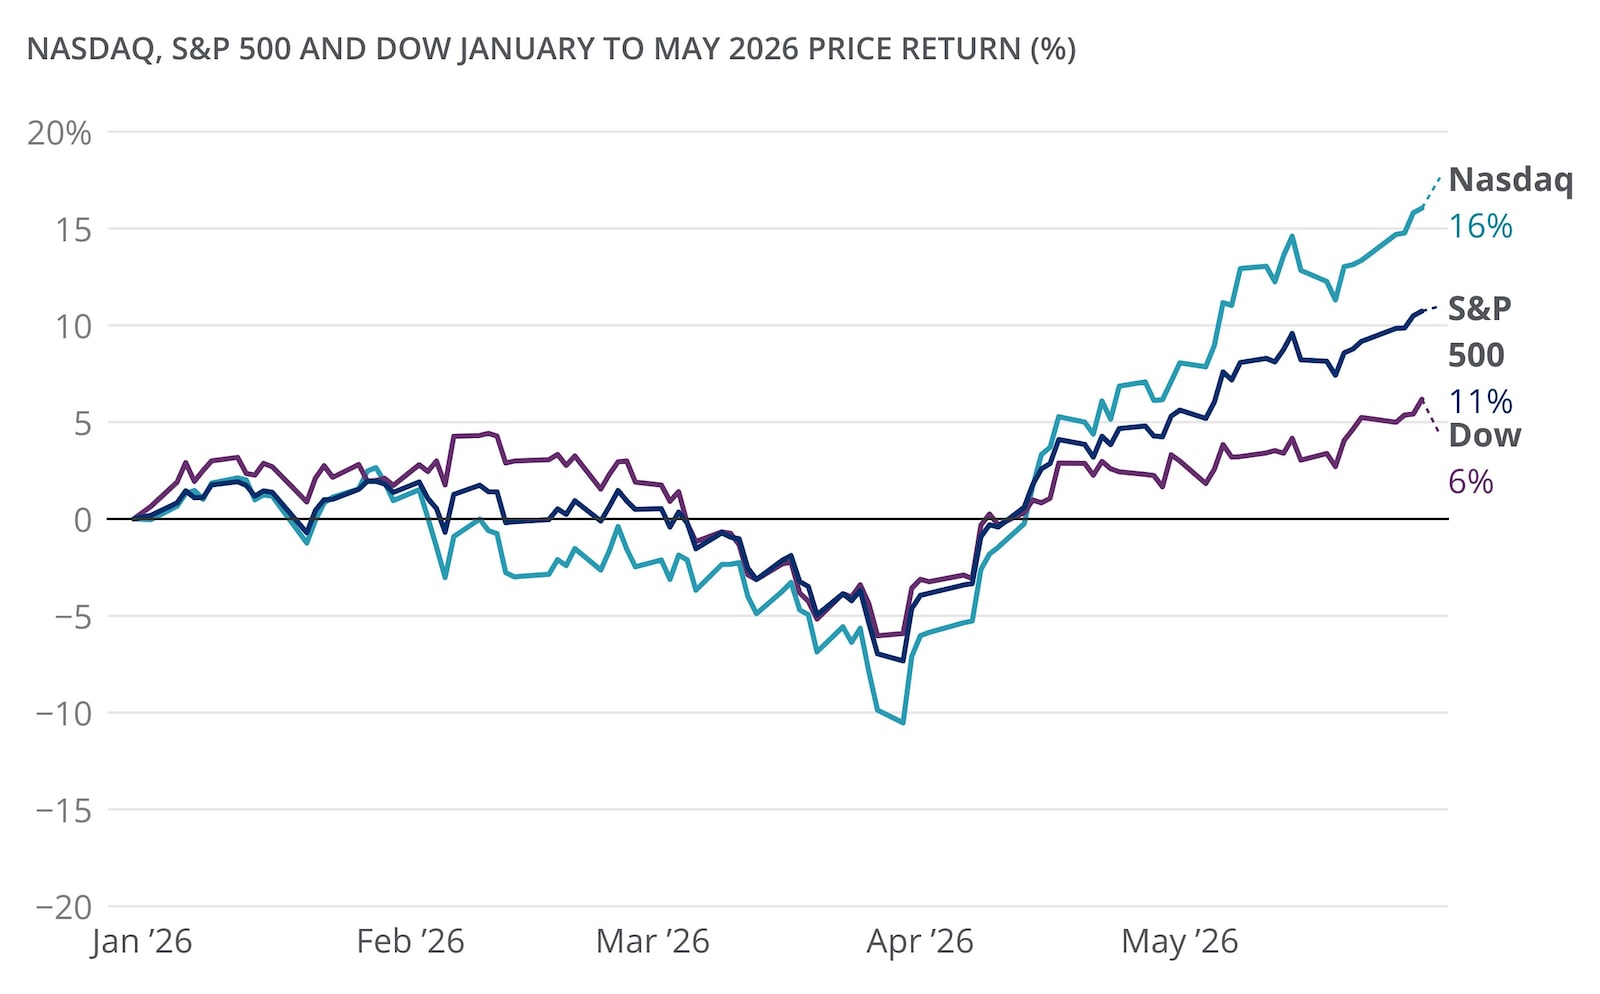
- All three major U.S. equities indexes closed at a record high at the end of May, driven in part by momentum related to artificial intelligence (AI) and a robust earnings season.
- The S&P 500 and Nasdaq posted strong year-to-date (YTD) gains of roughly 11% and 16%, respectively, while the Dow Jones Industrial Average has had a more modest gain of about 6% thus far in 2026.
- The YTD stock market returns tell only part of the performance story. Sector concentration and index construction may matter more.

All three major U.S. equities indexes posted record closing highs on the final trading day of May 2026. Heading into the summer months, the S&P 500 and Nasdaq have seen double-digit gains YTD. The Dow also ticked higher, but its gains have been more modest than the other indexes.
“For the second year in a row, the U.S. equity market has defied expectations after a geopolitical shock,” said Phil Camporeale, Chief Investment Strategist at J.P. Morgan Wealth Management. “The U.S. consumer has showed incredible resilience in the face of rising energy prices and combined with a generational capex cycle around AI, the S&P 500 has delivered six straight quarters of double-digit growth driving double digit index returns.”
Here’s how the stock market has been performing thus far in 2026, through the end of May, and what’s played a factor in that performance.
Stock market snapshot: 2026 year-to-date returns and recent milestones
By the end of May, the tech-heavy Nasdaq saw a YTD gain of about 16%. The S&P 500 followed with a gain of about 11%. And the Dow saw a YTD increase of about 6%.
The Nasdaq and S&P 500 have outpaced the Dow year to date
YTD returns measure the percentage change in an index from the final close of the prior year to the most recent close. This metric says nothing about the up-and-down swings that occur in between, whether gains were broad-based or narrow, or how performance compares to longer-term norms.
It’s also important to understand the distinction between price return and total return. When price returns are being tracked, only changes at the index level are being considered. Total return, however, adds in reinvested dividends, which can meaningfully lift the final number over time, particularly for the S&P 500 and Dow where many component companies pay regular dividends.
To put this in context, the S&P 500’s historical average annual total return has been approximately 10% over the long run and closer to 16% over the past decade. One-month, three-month and trailing 12-month returns all tell different stories; for long-term investors, the compounding picture typically matters most.
What’s impacting stock market returns in 2026
Several forces can be seen as having an impact on the stock market’s performance thus far this year, though it’s wise to remember that it’s not always a direct cause and effect. Let’s consider them.
AI and semiconductor momentum
Technology and semiconductor stocks have been a consistent source of market gains. Specifically, investor enthusiasm toward AI infrastructure and chip demand lifted the broader market during upswings, contributing to the Nasdaq’s performance and to the S&P 500’s ability to recover quickly from pullbacks.
A strong earnings season
Corporate earnings broadly exceeding expectations also bolstered risk appetite between January and May. With roughly 97% of S&P 500 companies having reported results by late May, approximately 85% topped earnings estimates – well above the five-year average of 78%. Revenue growth has also run ahead of historical norms.
Geopolitical and energy-related volatility
Not all of 2026 has been smooth, however. The escalation of the conflict in Iran disrupted shipping through the Strait of Hormuz, sending benchmark Brent crude oil to peak 2026 prices above $113 per barrel at points in March, April and May. That supply shock has contributed to inflation concerns and changes in Federal Reserve policy expectations, as well as contributed to significant index-level drawdowns in late February and March. Recoveries have been fast, but the underlying uncertainty hasn’t fully lifted.
Get up to $1,000
When you open a J.P. Morgan Self-Directed Investing account, you get a trading experience that puts you in control and up to $1,000 in cash bonus.
S&P 500: How it’s performing so far in 2026
The S&P 500 is a market-cap-weighted index of 500 large U.S. companies, spanning all 11 recognized market sectors. Because larger companies carry more weight, much of the index’s roughly 11% YTD gain and record close of 7,580.06 on May 29 has been shaped by technology and semiconductor names benefiting from AI-driven earnings optimism.
Currently trading at roughly 21x expected forward earnings, the index’s valuation has moderated from its late-2025 peak valuation of around 23x. That repricing reflects rising earnings expectations running faster than prices, which many investors often view as a healthy dynamic.
Looking ahead, the path of oil prices, the trajectory of inflation and the Federal Reserve’s response to both remain the variables worth watching. If oil costs stay elevated for an extended period, the effects on consumer spending and corporate margins could weigh on future earnings growth.
Nasdaq: How it’s performing so far in 2026
The Nasdaq Composite has been the strongest performer among the three major indexes in 2026, gaining roughly 16% on a price-return basis YTD through May 29. The index saw multiple record closes in May, reaching as high as 26,972.62 on May 29. That strength is largely a function of how the Nasdaq is constructed: The index skews heavily toward technology and growth-oriented companies, which means it benefits most directly when AI enthusiasm runs high and earnings from mega-cap technology firms beat expectations.
That concentration, however, is also a risk factor worth keeping in mind. When relatively few companies account for a disproportionate share of index-level gains, the headline returns we all see may not reflect how weak participation is in other areas of the market.
The Nasdaq did experience a significant correction and subsequent rebound earlier in the year as geopolitical tensions escalated, illustrating how quickly sentiment-driven indexes can swing in both directions.
Dow: How it’s performing so far in 2026
The Dow has had a choppier 2026 than the other two major indexes, gaining roughly 6% YTD on a price-return basis through May 29. In a widely recognized milestone, the 30-stock index crossed 50,000 for the first time on February 6. It then gave back that ground, correcting approximately 10% from the peak by late March as the conflict in Iran escalated and inflation concerns mounted.
The Dow has since staged a recovery, retaking the 50,000 level in mid-May, before consolidating those gains ahead of a new record close of 51,032.46 on May 29. Despite its recent records, the Dow still lags well behind the more significant YTD gains posted by the Nasdaq and S&P 500.
This divergence is at least partly explained by the index’s structure and composition. The Dow is price-weighted rather than market-cap-weighted, meaning companies with higher share prices carry more influence over the index’s movement, regardless of their overall size. It also holds just 30 companies, with a tilt toward industrials, financials, consumer staples and healthcare. These sectors simply have not participated as strongly in the AI and semiconductor rally as technology names have.
S&P 500, Nasdaq and Dow Performance January to May 2026
2025 Year-End Close | YTD Price Return | May 2026 Record Close |
|---|---|---|
S&P 500 | ||
6,845 | 10.73% | 7,580 |
Nasdaq Composite | ||
23,243 | 16.05% | 26,973 |
Dow Jones Industrial Average | ||
48,063 | 6.18% | 51,032 |
Source: Yahoo Finance; price return only, from December 31, 2025, close through May 29, 2026, close.
Why stock market indexes don’t all move the same way
The gap in YTD performance between the Nasdaq and the Dow in particular highlights an important element of stock selection. The Nasdaq carries a heavy weighting in the types of technology and growth stocks that have led the market in 2026, while the Dow’s 30-stock roster tilts toward established blue-chip names (rather than high-growth technology companies). In addition, the Dow’s price-weighted construction means share price, not company size, determines how much influence each holding has over the index’s daily movement.
These structural differences tend to be amplified during periods of market rotation. When investors favor growth, the Nasdaq may benefit most. When sentiment tilts toward defensive or value-oriented sectors, the Dow’s composition may offer more resilience. While the documented behavior of the indexes under various market conditions can help investors position themselves, it’s important to keep in mind that past performance does not guarantee future results.
Market participation, also known as breadth, matters here, too. When we see headlines about the Nasdaq and S&P 500 making new highs, it can generate FOMO (fear of missing out), which can beget more momentum. But understanding how many stocks are participating in the rally provides important context about the health and sustainability of stock market gains.
What investors can consider through the end of 2026
Investors can take this time to review their portfolio and better understand their stock market exposure. If your asset allocation has shifted over time and you’re overinvested in one sector or are more heavily invested in one index, it may be time to rebalance your portfolio. Continue to focus on your long-term goals, and ensure your investment strategy fits your time horizon and risk tolerance.
The bottom line
The S&P 500 and Nasdaq have delivered strong price returns in the first five months of 2026, with earnings providing a framework on which both indexes have repeatedly hit record levels. The Dow has trailed its counterparts – partly reflecting its more limited exposure to the technology-driven rally – but has still notched new records, too.
The gaps between the market gauges are a reminder that no single index is the whole picture. For investors looking to understand their overall stock market exposure, paying attention to how your own portfolio is positioned relative to these benchmarks – and why these benchmarks behave differently from one another – may be more useful than tracking any single headline number.
Invest your way
Not working with us yet? Find a J.P. Morgan Advisor or explore ways to invest online.
Editorial staff, J.P. Morgan Wealth Management