Why are stocks at record highs with no Iran resolution?

A nearly 10% drawdown, and a swift recovery. All within just six weeks. The S&P 500 is now trading near all-time highs. And yet, there has been no resolution to the conflict in Iran, or even a clear roadmap of next steps. Just a naval blockade around one of the world’s busiest waterways.
Markets sell first and ask questions later in the face of uncertainty. That’s no secret. But stock market bounce backs seem to be happening faster and faster. In some ways, it’s a sigh of relief. But it breeds a nagging question: Is the market shrugging off conflict risk… again? Or are investors anchoring their hopes on something more durable?
A faster-than-ever V-Shaped rebound
For some, the market action over the past two weeks has been a headscratcher. Several major global equity indexes hit or approached record highs in a tear that included a 13-day Nasdaq‑100 winning streak, marking its longest string of gains in over a decade. Even the S&P 500 and Russell 2000 have seen 9% and 11% month‑to‑date gains, respectively. The rally has been indiscriminate.
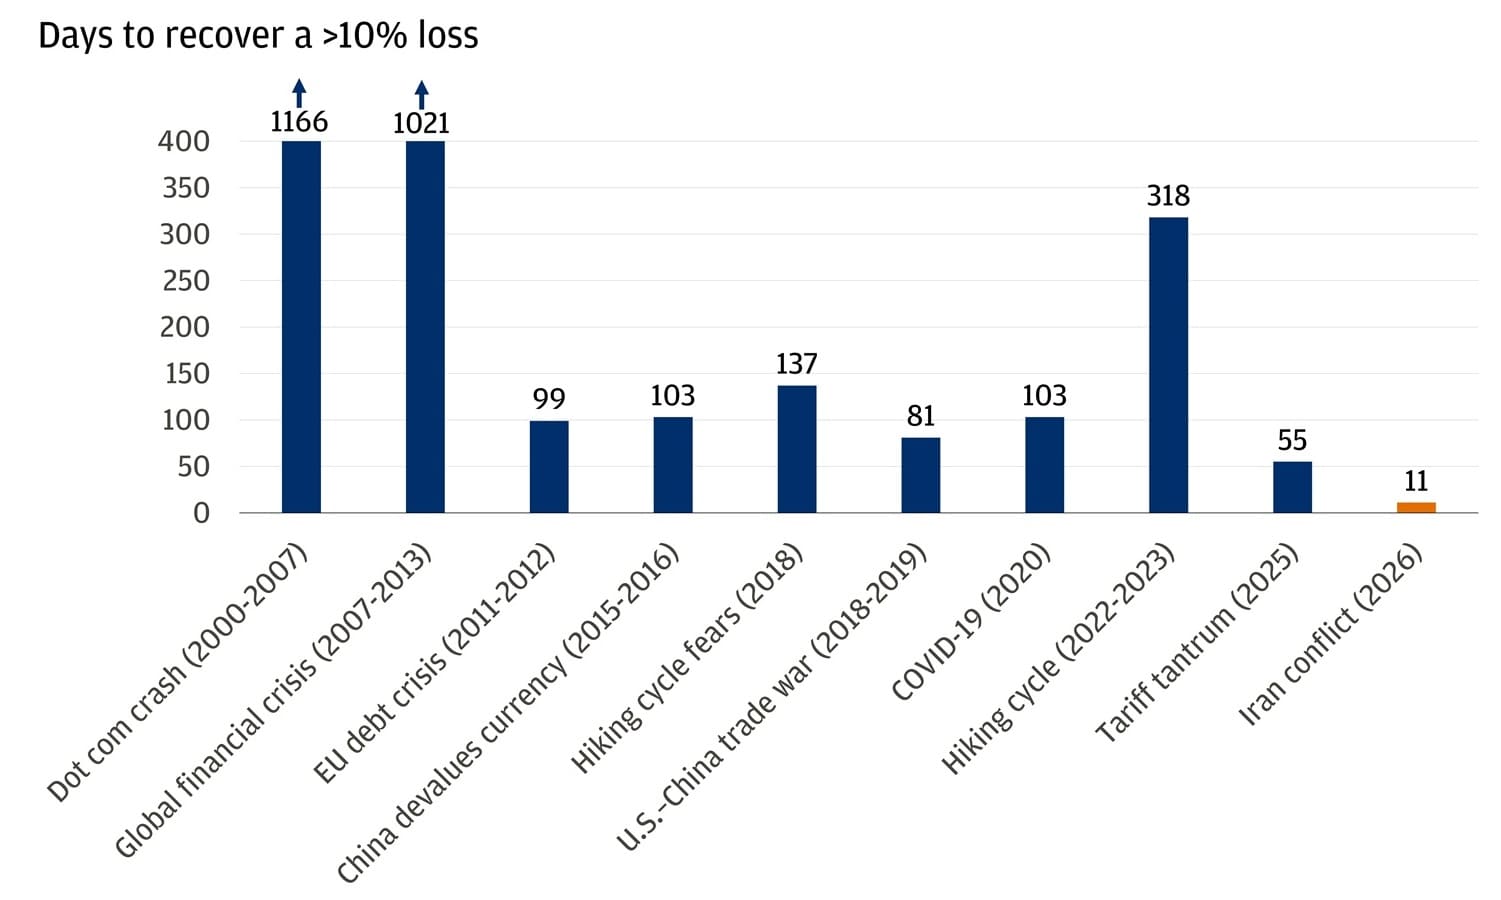
The speed of the rebound may seem extreme. After a nearly 10% drawdown in the S&P 500, a full recovery to preconflict levels took only 11 trading sessions. Cautious investors may think that’s too fast, but over the years, recoveries have become faster and faster thanks to outsized liquidity, evolved market structures and often easier monetary policy. Staying invested, despite geopolitical volatility, can yield long-term gains. Investors remember that and are favoring reengagement.
Market declines have recovered faster and faster
Outlooks and past performance are no guarantee of future results. It is not possible to invest directly in an index.
Ready to take the next step in investing?
We offer $0 commission online trades, intuitive investing tools and a range of advisor services, so you can take control of your financial future.
The pace around the world
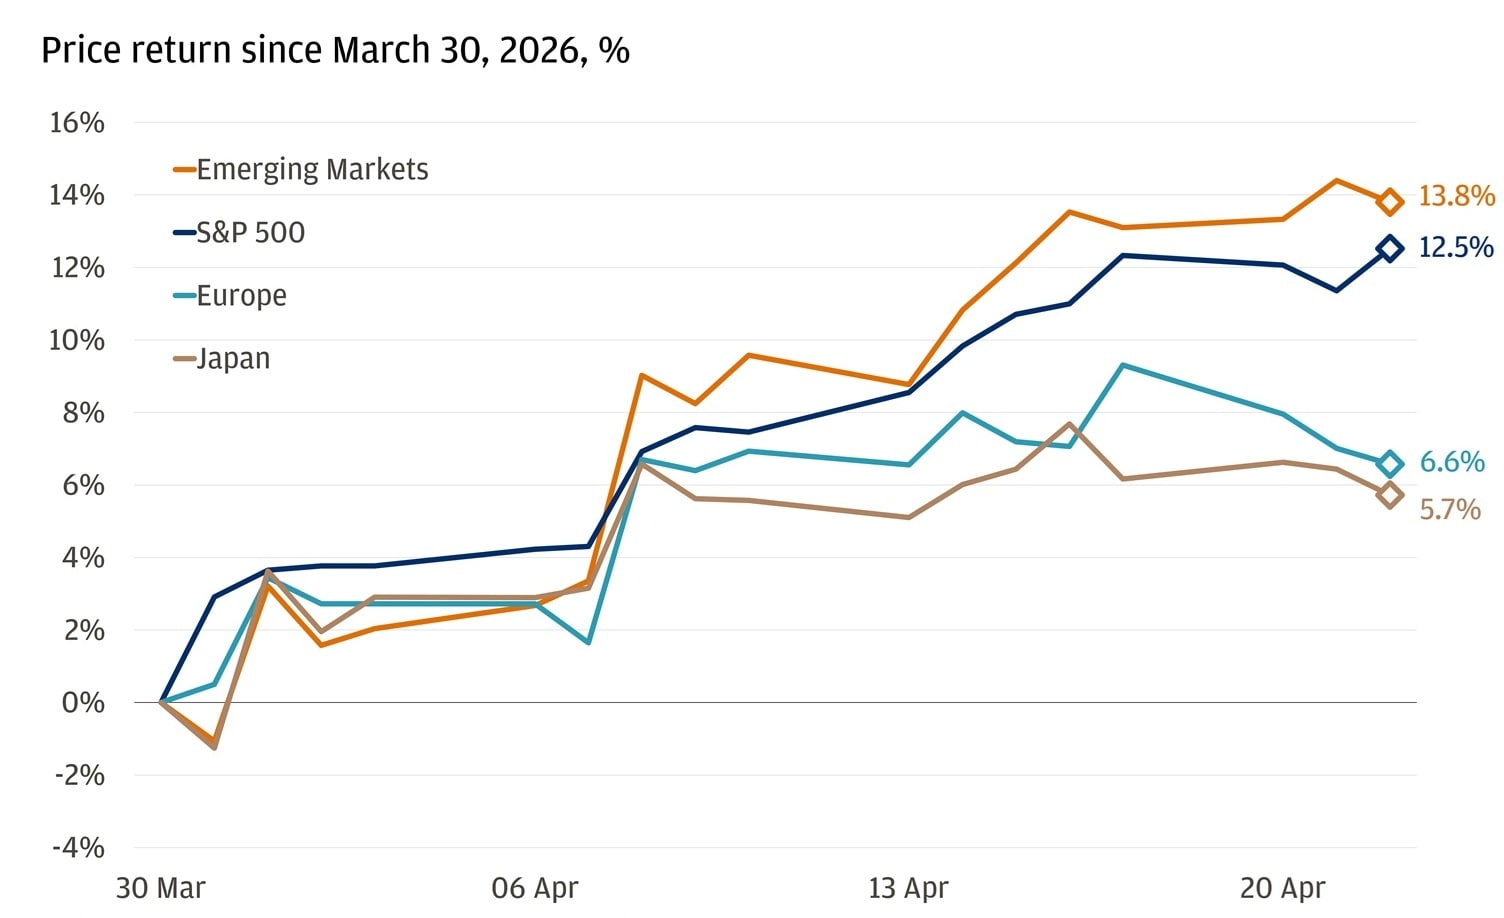
It’s a similar story abroad. Korean and Taiwanese markets reached record levels. Emerging markets rebounded at an even faster rate than the U.S. benchmarks.
But the recovery has been uneven, and that divergence matters. Europe and Japan – despite seeing fierce rebounds – continue to trade well below preconflict peaks.
The rebound hasn’t been felt equally across regions
Outlooks and past performance are no guarantee of future results. It is not possible to invest directly in an index.
In Europe, the explanation is straightforward. The region outperformed earlier in the year, in line with international outperformance, and valuations rose alongside aggressive earnings expectations. Going into the energy shock, Europe was already quite vulnerable.
And now, the worry isn’t just about relative valuations, but negative earnings going forward. It’s far from the rosier picture seen in the United States, especially as Europe lacks one of the key drivers of this stock market recovery: a technology weighting.
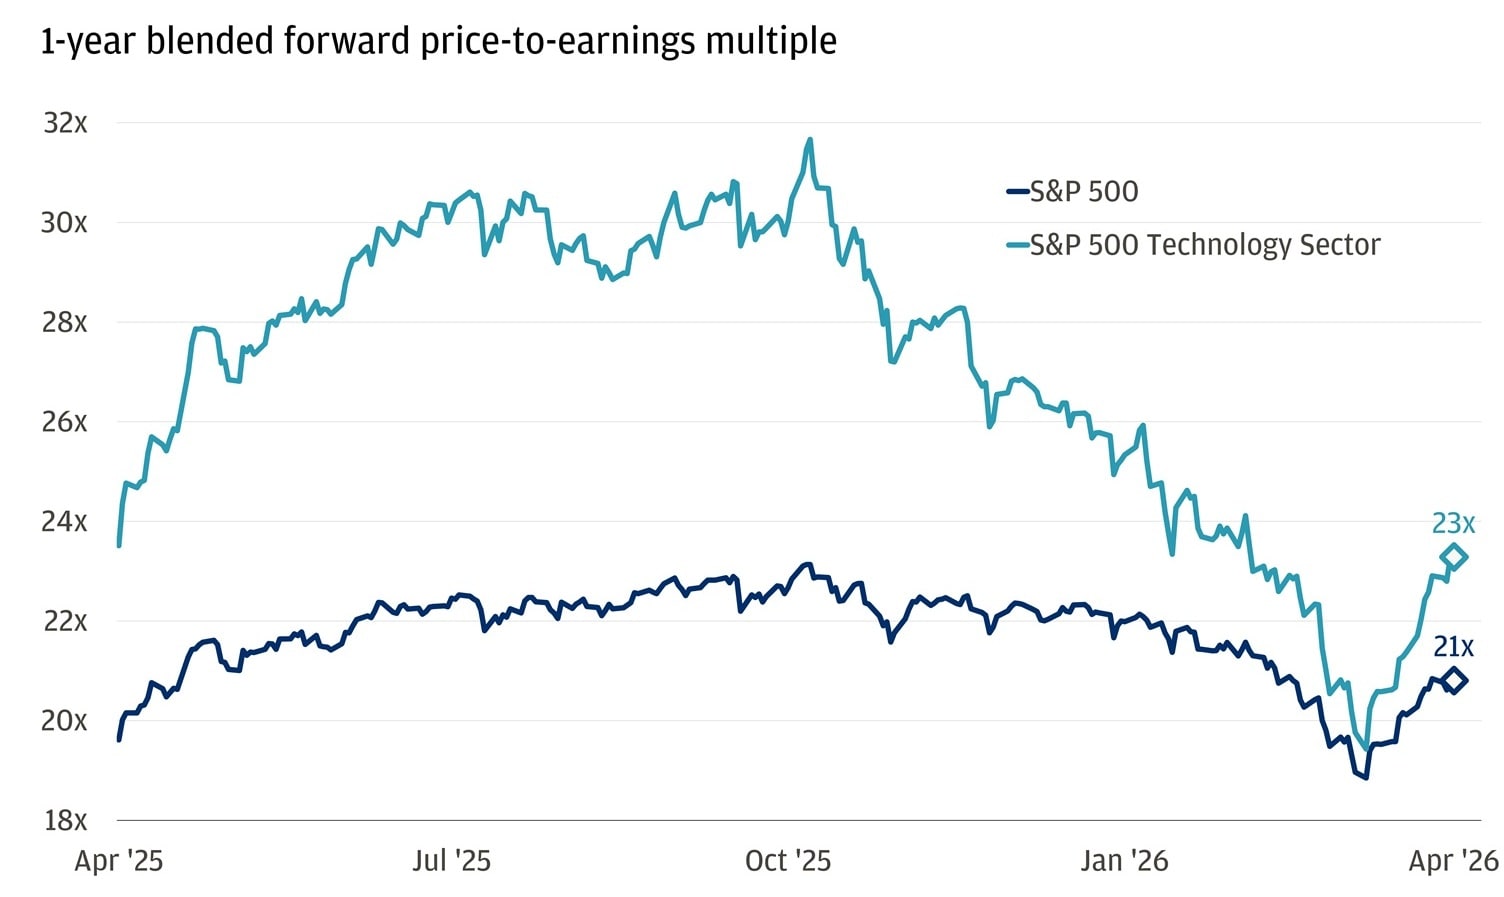
Prices bounced back, but valuations lagged
Although the S&P 500 returned to its best levels last week, its valuation has fallen from peak levels. At the end of 2025, the benchmark traded above 23x on a one-year blended forward price-to-equity basis. Today, that figure is below 21x. And the repricing is even more dramatic in the technology sector.
Tech valuations are far from their highs
It’s more than just the price recovery. Future earnings expectations have risen even faster, even as the conflict in Iran weighed on investors. But here’s the twist: the rebound was already underway before geopolitical clarity improved. That suggests this rally is being driven less by confidence around the war and more by faith in the fundamentals.
Earnings didn’t blink
The prevailing fear during the drawdown was that conflict-related consequences would bleed into corporate margins, investment and ultimately consumer behavior. Instead, early earnings reports show the opposite.
Companies are beating Wall Street’s earning expectations at a pace we haven’t seen in years. With about 25% of the S&P 500 having reported quarterly results so far, roughly 83% have topped earnings estimates. That stands well above the five-year average of 78%. Revenue growth is also on track for its strongest levels since 2022, with 77% of companies topping revenue estimates relative to the five-year average of 70%.
With both revenue and earnings beating estimates at this rate, the recent rally to all-time highs would signal that the bid has been backed by well-founded conviction in corporate America’s fundamentals.
If the rest of earnings season delivers as expected, it would mark six straight quarters of double-digit earnings growth – the longest such streak since the recovery from the 2008 financial crisis.
That said, even with the outsized growth projections, the median stock is expected to grow earnings by about 8%, marginally higher than the 7.5% historical average for the index as a whole. That divergence is driven by the technology story. Powerful earnings growth reinforces that the rebound is not a knee-jerk rally but a durable reflection of strength in the tech sector and the broader index.
All market and economic data as of 04/24/2026 are sourced from Bloomberg Finance L.P. and FactSet unless otherwise stated.
You're invited to subscribe to our newsletters
We'll send you the latest market news, investing insights and more when you subscribe to our newsletters.

Executive Director, Global Investment Strategist, J.P. Morgan Private Bank

Global Investment Strategist