How tech became everything to everyone

Executive Director, Global Investment Strategist, J.P. Morgan Private Bank

When investors are excited about AI, they have bought tech. When they’re worried about inflation, they bought tech. When looking for outperformance, they bought tech. When thinking about sustainability, they bought tech. When they wanted to invest in growth, they bought tech. When they wanted to lean into the Capex cycle, they bought tech. When worried about the world and in need of a company with a cash cushion, they bought tech.
These are just some of the many reasons investors have leaned into tech, even in the face of lofty valuations. The sector has been perceived as the answer to everything and everyone. It’s a must-have portfolio allocation, both a cyclical and defensive trade and the driver of earnings growth. How did we get here?
Extraordinary earnings
Ahead of the first quarter earnings season of 2026, the tech sector was expected to contribute nearly half of expected earnings growth. That’s more than triple the estimate for the S&P 500 as a whole. Supported by surging revenue growth, operating profit has soared, outpacing headcount additions, which in turn has fed margin expansion. In short, scale is working in their favor as the largest technology platforms continue to grow while keeping incremental costs contained.
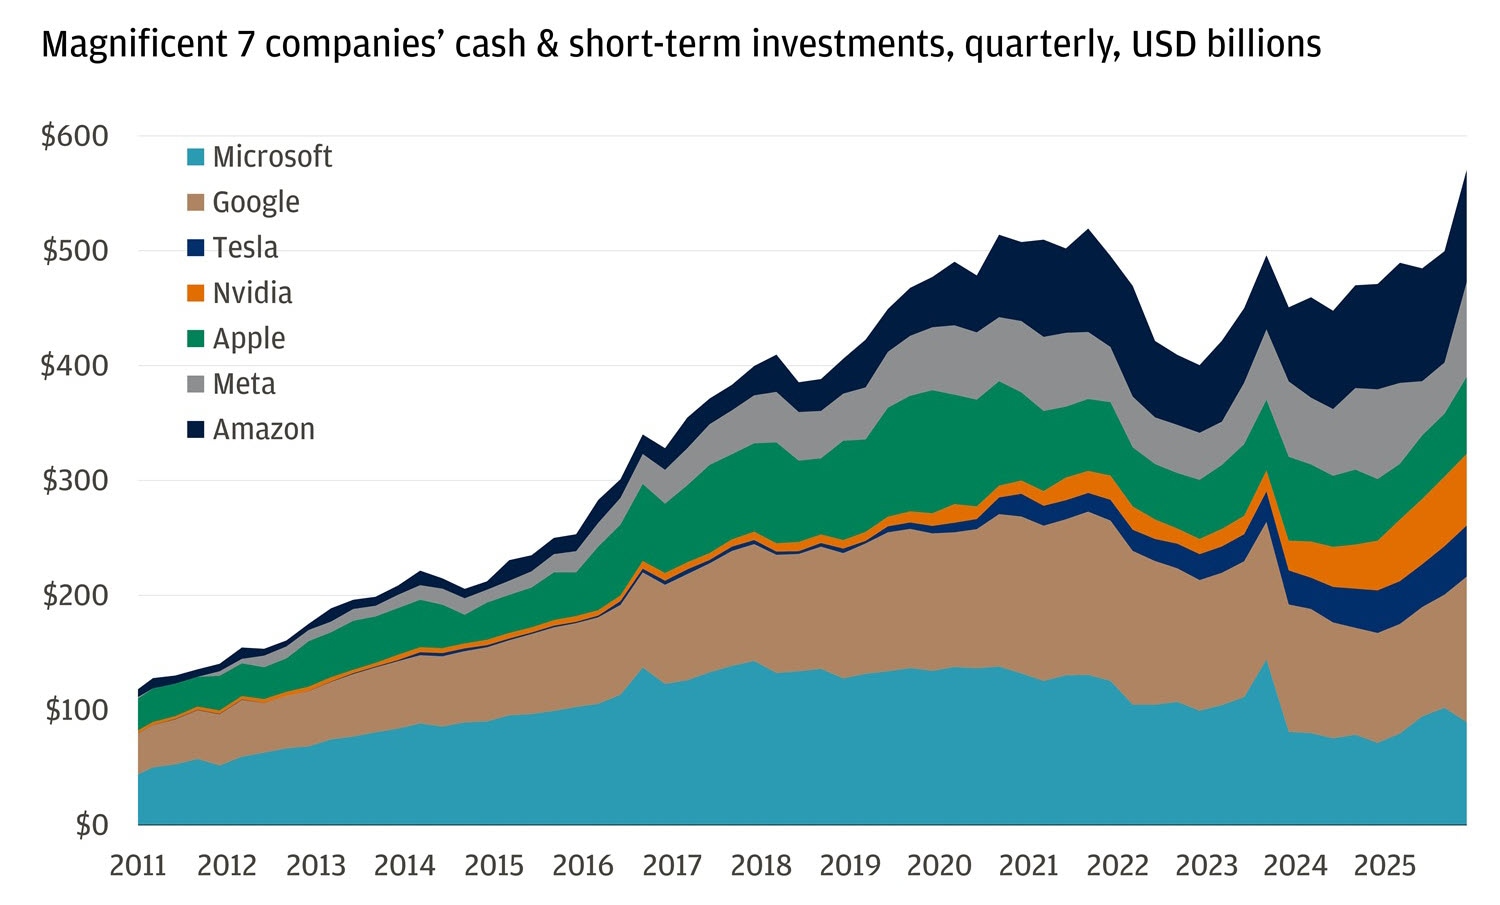
At the turn of the century, technology stocks were purely a growth trade. The internet was coming and the world knew it. But earnings lagged the structural shift at play. Cue the dot-com bubble. Then, after the global financial crisis of 2008, they became something else: a duration trade. A low-interest-rate regime and growing liquidity on its balance sheet, thanks to post-COVID issuance at near-Treasury-level rates and extraordinary free cash flow, helped build their cash cushion. Cash holdings in the Magnificent Seven stocks – which now make up about 35% of the S&P 500 – grew over 300% between 2011 and 2025.
Cash balances have skyrocketed since the financial crisis
But even with – and perhaps because of – fortress balance sheets, technology stocks remain sensitive to changes in interest rates as their valuations hinge on cash flows far into the future. They are after all, still growth stocks. And yet, also a play on changing interest rates.
Durable earnings and cash buffers have made the sector resilient even if economic conditions weaken. It’s no longer a question of growth or even speedy growth. Quarter by quarter, the stocks are measured by whether they can beat high investor expectations. In other words, can the A+ student continue to get an A+ on its earnings report card?
And yet, they remain some of the most volatile stocks in the market. A normal range of movement in either direction for the seven biggest tech stocks is over 60% larger than that of the S&P 500. It’s rare for a single sector to embody so many different aspects at once.
Ready to take the next step in investing?
We offer $0 commission online trades, intuitive investing tools and a range of advisor services, so you can take control of your financial future.
Tech’s ‘Industrial Era’
For all its association with growth and the biggest players benefitting from defensive bids, tech is also deeply cyclical – whether it’s the short boom and bust cycles of semiconductors, ad spend associated with search engines and social media or subscription-based growth at the whim of business investment.
Now, with the innovation of artificial intelligence, it’s all about physical infrastructure while already being deeply embedded in the digital ecosystem and a core portfolio allocation.
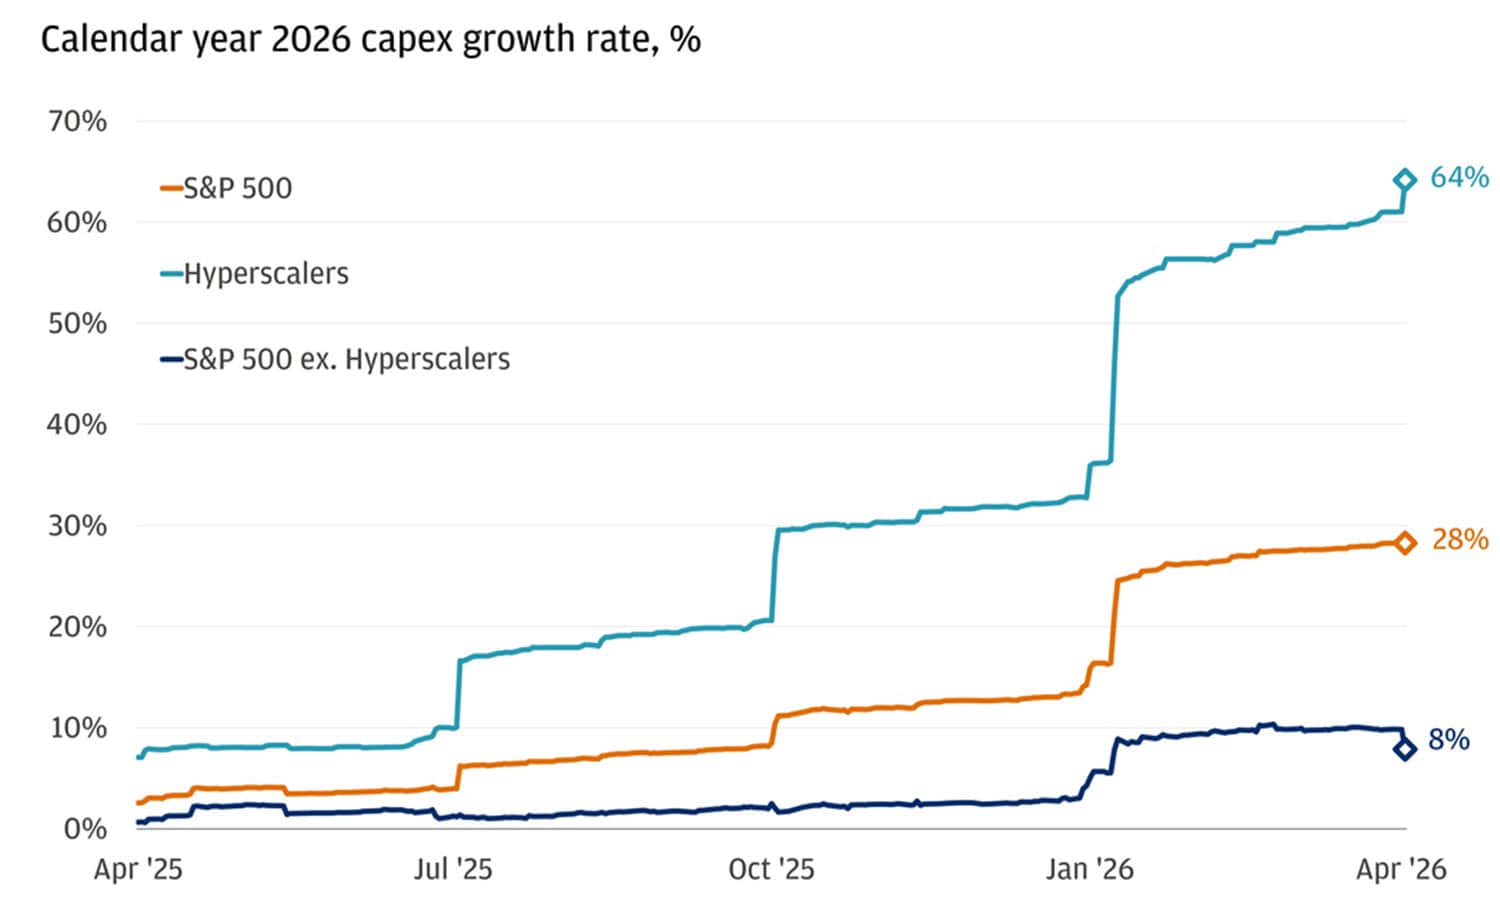
At the helm of the AI wave, tech companies are driving a surge in capital expenditure – data centers, chips and energy infrastructure on a historic scale. This begins to resemble older industrial cycles, where growth depends less on asset-light scalability and more on the ability to deploy vast amounts of capital efficiently.
For decades, tech’s appeal has been high capital returns and minimal reinvestment needs. Now, it’s the opposite: pouring billions into physical infrastructure to sustain the next wave of growth.
Hyperscaler capital expenditures are rising rapidly
Tech is simultaneously long-duration and cyclical, defensive and high-beta, capital-light and capital-intensive.
Technology, meet fragmentation
The infrastructure buildout and growth in the tech sector have become increasingly synonymous with the United States economy’s growth prospects. That, in turn, raises questions around supply chain resilience and nearshoring. It’s not enough to source chips and raw materials from around the world in an economically feasible way.
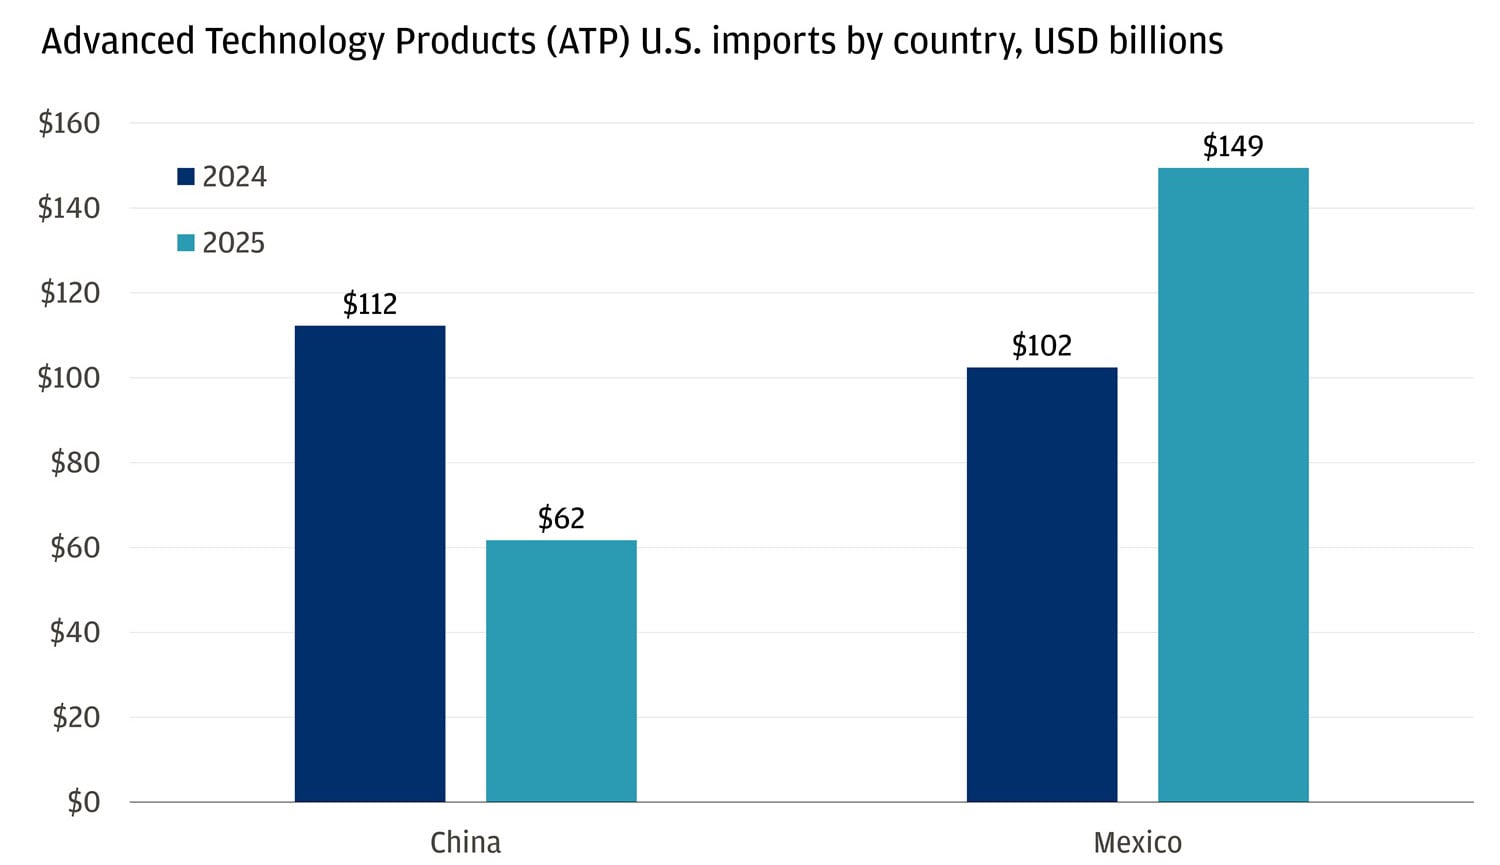
Paying a premium to fund a physical buildout on sovereign soil and supply chains that are both diversified and a shorter distance from the end consumer is more palatable than ever. As part of the broader deglobalization trend, the clearest example of the shift in technology is the increased imports of advanced technology products from Mexico, at the expense of China’s share.
U.S. reliance shifts from China to Mexico
In a variety of macroeconomic regimes, technology has become the market’s default answer – not because it fits neatly into any one category, but because it fits into all of them. That breadth is its strength and for now, the sector continues to deliver.
All market and economic data as of 05/01/2026 are sourced from Bloomberg Finance L.P. and FactSet unless otherwise stated.
You're invited to subscribe to our newsletters
We'll send you the latest market news, investing insights and more when you subscribe to our newsletters.
Executive Director, Global Investment Strategist, J.P. Morgan Private Bank