S&P 500 vs. Dow: What sets these market indexes apart?

Editorial staff, J.P. Morgan Wealth Management
- The S&P 500, a market-cap-weighted index of 500 large U.S. companies, is widely viewed as a broad benchmark for the U.S. stock market.
- The Dow Jones Industrial Average (Dow for short) tracks 30 large, established U.S. companies; it’s also price-weighted, meaning higher-priced stocks carry more influence.
- Both indexes offer insight into market trends and can be accessed through mutual funds and ETFs, making them practical tools for long-term investors.

If you tune in to a financial news program for even a few minutes, you’ll likely hear discussion about how the S&P 500 is performing and whether the Dow is up or down for the day. In fact, these two indexes are quoted so often that it’s easy to assume everyone automatically understands what they represent.
Market indexes like the S&P 500 and the Dow serve an important purpose: They act as barometers for the broader stock market, helping investors gauge trends and the health of the economy overall. When markets rise or fall, these indexes function as benchmarks, giving investors a way to measure how their own portfolios are performing compared to the broader market.
Understanding how these indexes are structured – and why they sometimes tell slightly different stories – can make you a more informed investor. In this article, we’ll break down how each index is built, how it’s calculated, what sectors it emphasizes and – most importantly – what it means for your investment portfolio.
What is the S&P 500?
The S&P 500 is a stock market index that tracks 500 of the largest publicly traded companies in the United States across multiple market sectors. It is widely considered one of the best indicators of the health of the overall U.S. equity market.
Unlike an exchange such as the New York Stock Exchange or the Nasdaq, the S&P 500 is not where stocks are bought and sold. Instead, it measures the performance of 500 “large-cap” companies that trade on U.S. stock exchanges. The index includes names like Apple, Microsoft, Amazon, Alphabet and Berkshire Hathaway. Companies are selected based on market capitalization (market cap), liquidity and sector representation criteria. Market cap refers to the total value of a company’s outstanding shares.
In its modern form, the S&P 500 traces its roots back to 1957, though its predecessor dates back to the 1920s. Over time, the index has become a widely used benchmark for institutional and retail investors alike. In fact, many investors consider the S&P 500 a proxy for “the U.S. market” in general.
In terms of records, the S&P 500 has hit multiple all-time highs in recent years, reflecting strong corporate earnings and investor confidence. Historically, it has delivered average annual returns of around 10% over the long term (before inflation), though returns vary year to year.
What is the Dow Jones Industrial Average?
The Dow Jones Industrial Average (DJIA), often referred to simply as “the Dow,” is one of the oldest and best-known stock indexes in the world. Created in 1896 by Charles Dow and Edward Jones, it originally tracked just 12 industrial companies. Today, it includes 30 large blue-chip companies chosen for their sector significance and overall relevance to the U.S. economy. Current companies include household names such as Apple, Johnson & Johnson, Coca-Cola and McDonald’s.
Unlike the S&P 500, the Dow is price-weighted, which means a company with a higher stock price has more impact on how the index moves, even if that company isn’t the largest by overall size. For example, if a $400 stock in the Dow moves significantly, it will have a greater impact than a $100 stock, even if the $100 stock represents a larger company overall.
Get up to $1,000
When you open a J.P. Morgan Self-Directed Investing account, you get a trading experience that puts you in control and up to $1,000 in cash bonus.
How are the S&P 500 and the Dow calculated?
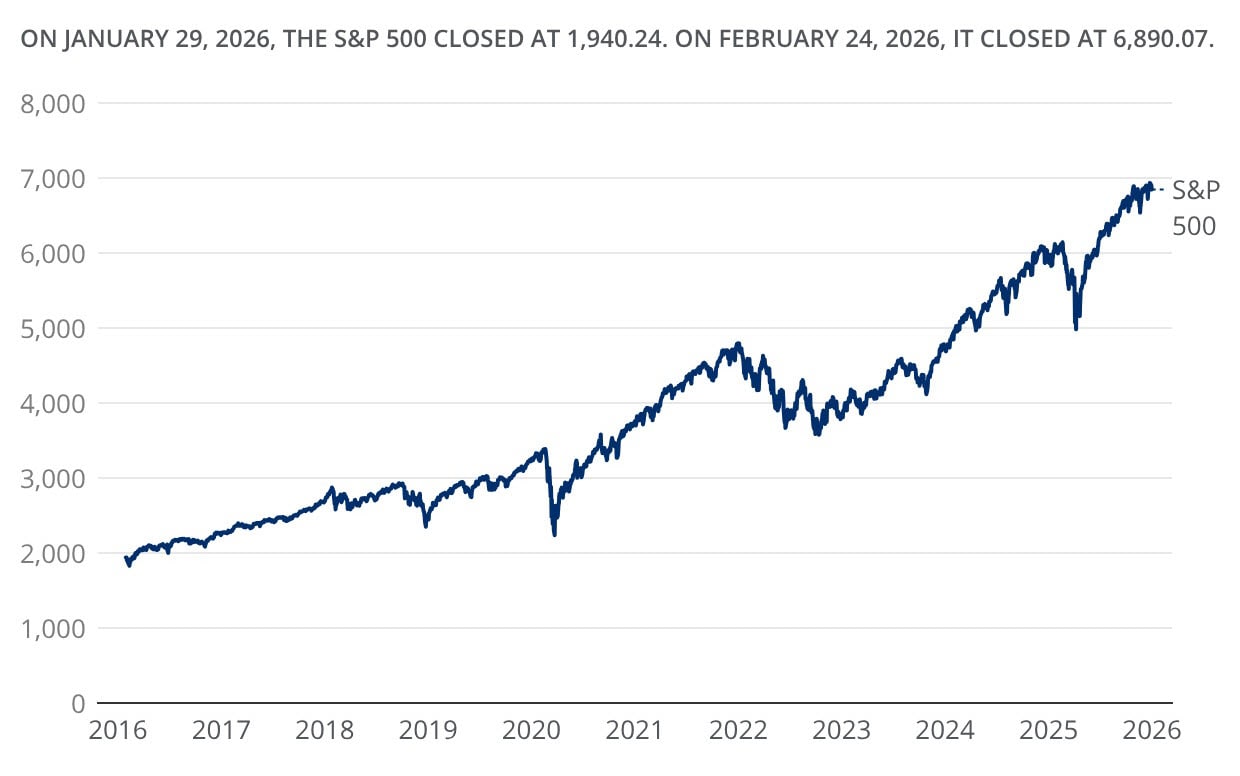
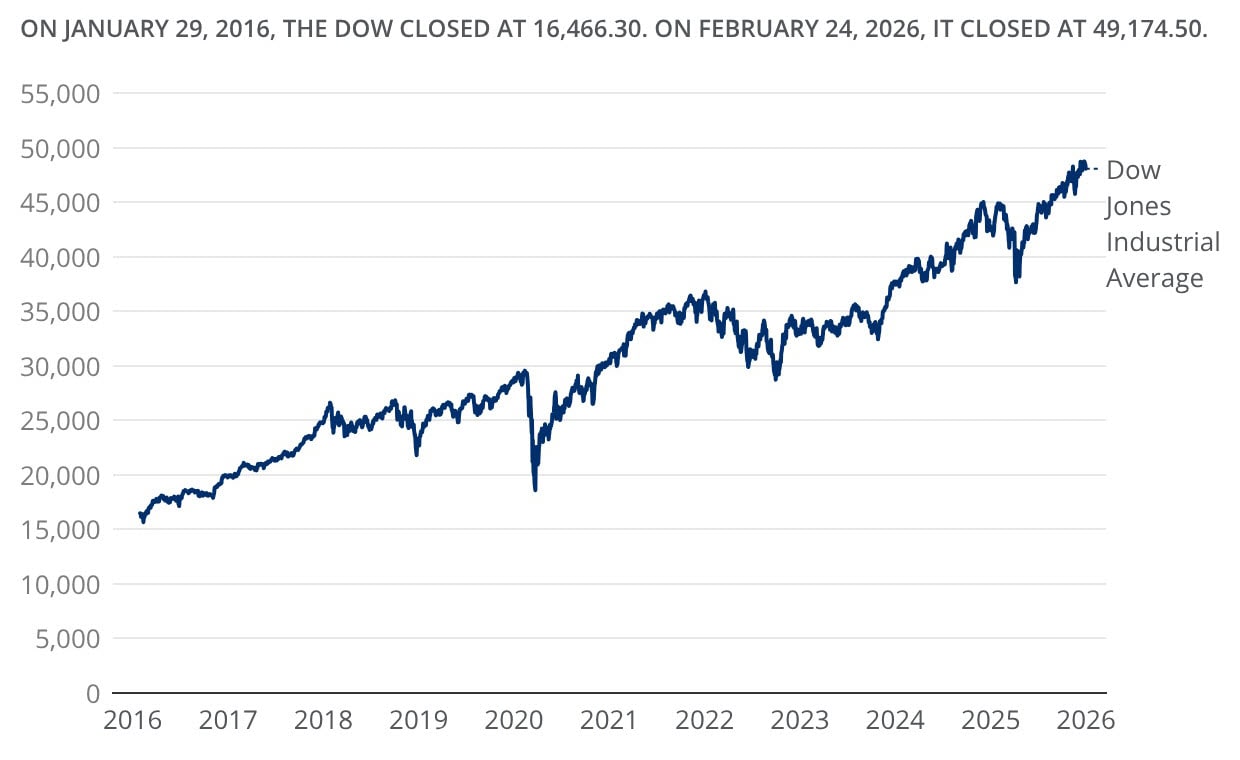
One common question is “Why is the S&P 500 around 7,000, while the Dow is near 49,000?” The answer lies in how each index is calculated.
The S&P 500 is calculated using a market-cap-weighted formula, which means larger companies have more influence on the index. The total float-adjusted market value of all 500 companies is added together and divided by a number called the index divisor. The divisor adjusts for stock splits and other corporate actions so the index isn’t distorted. When the S&P 500 is at 7,000, that doesn’t mean stocks cost $7,000; rather, the number simply reflects how much the combined value of those companies included in the index has grown relative to its starting point.
The S&P 500’s market-cap weighting means larger companies have more influence. If the biggest companies rise sharply, the index can climb even if smaller companies lag.
The Dow works differently. It’s price-weighted, so higher-priced stocks carry more influence regardless of company size. The stock prices of the 30 companies included in the index are added together and divided by the Dow divisor. So when the Dow sits near 49,000, that number is just a mathematical output – not a total company value or an average stock price.
The Dow’s price-weighted system means the actual stock price matters more than the size of the company. A high-priced stock can disproportionately move the index. This structural difference is one reason the two indexes sometimes behave differently.
The main point? The headline numbers of the S&P 500 and the Dow aren’t dollar amounts. They're more like scaled scoreboards of performance for a certain slice of the stock market, and the values of each index are not directly comparable to each other.
Key differences between the S&P 500 and the Dow
S&P 500 vs. the Dow
S&P 500 | The Dow |
|---|---|
Market representation | |
Tracks 500 large U.S. companies for broad exposure across industries; commonly acknowledged as an indicator of the stock market and economy | Tracks 30 blue-chip U.S. companies considered leaders in their industries for a narrower focus of market performance |
Sector focus | |
Weighted by market size, so sectors with the largest companies (like technology) often have greater influence | Includes multiple industries but with limited representation due to only being inclusive of 30 companies |
Potential investor implications | |
Often viewed as a benchmark for the overall U.S. stock market and widely used in index funds and retirement portfolios | Frequently cited in media headlines; reflects performance of major, well-known corporations but not the full market |
How it’s calculated | |
Market-cap-weighted – larger companies have greater impact on index movement; adjusted by an index divisor to account for corporate actions | Price-weighted – higher-priced stocks have more influence regardless of company size; uses a divisor to adjust for stock splits and changes |
Market representation
The S&P 500 covers roughly 80% of total U.S. stock market capitalization. Because it includes 500 companies across sectors, it provides a broader view of the market and is widely accepted as the best indicator of large-cap U.S. stocks.
In contrast, the Dow includes just 30 companies. And while they’re large and influential, the smaller number of companies means the Dow doesn’t necessarily reflect the overall market. It’s more of a curated list of blue-chip leaders than a comprehensive cross-section.
Sector focus
The S&P 500 reflects sector weightings based on market size. For example, technology often represents a significant portion due to the large market caps of companies like Apple and Microsoft.
The Dow also includes companies across several sectors (excluding utility and transportation, which are represented in separate Dow Jones indexes). Because it has just 30 companies, though, the Dow’s sector representation is simply more concentrated. It may not fully reflect the growth of emerging industries in the same way the S&P 500 does.
Potential investor implications
The S&P 500 is often used as a benchmark for diversified portfolios and is commonly tracked by index funds, including mutual funds and exchange-traded funds (ETFs). It’s viewed as a reliable indicator of the overall condition of the U.S. economy because it represent all 11 of the recognized market sectors:
- Information technology
- Health care
- Consumer discretionary
- Financials
- Communication services
- Industrials
- Consumer staples
- Energy
- Utilities
- Real estate
- Materials
The Dow is often cited in media headlines because of its long history and relative simplicity. Indeed, it can offer a quick sense of how major, established companies that are considered relevant in the U.S. economy are performing; however, its narrower scope may not always reflect broader market dynamics.
Historical performance of the S&P 500 and the Dow
Over the long term, both the S&P 500 and the Dow have delivered similar overall returns, though one has outperformed the other at times. The S&P 500’s broader exposure to growth sectors has, on occasion, led to stronger performance during technology-driven bull markets. In the past decade, the S&P 500 has generally outpaced the Dow in years when large technology companies drove market gains. During more value-oriented or industrial-led recoveries, the Dow has occasionally narrowed the gap.
S&P 500 performance 2016-2026
Dow Jones Industrial Average Performance 2016-2026
What investors can watch for with the S&P 500 and the Dow
Investors often look at the S&P 500 and the Dow as temperature checks for the broader market and economy. Both indexes rising steadily, for example, might reflect confidence in corporate earnings and economic growth. If there's volatility, however, dips in the market may signal uncertainty tied to inflation, interest rates or even geopolitical events.
The S&P 500’s broader exposure makes it a useful proxy for overall U.S. equity performance. Meanwhile, the Dow’s focus on established companies may offer insight into how mature, multinational firms are navigating economic shifts. Both can help give investors a more complete picture.
The bottom line
The S&P 500 and the Dow are useful tools for investors and analysts to evaluate the performance of the U.S. stock market and the economy overall. The S&P 500 offers broad, market-cap-weighted exposure to 500 large U.S. companies. The Dow provides a narrower, price-weighted snapshot of 30 established blue-chip firms. Understanding how each index is constructed – as well as what each represents – can help investors interpret market headlines and make more informed financial decisions.
Frequently asked questions about the S&P 500 and the Dow
The S&P 500 includes 500 large companies such as Apple, Microsoft, Amazon, Alphabet and Berkshire Hathaway. The Dow includes 30 companies such as Apple, Johnson & Johnson, Coca-Cola and McDonald’s.
Both indexes are influenced by corporate earnings, interest rates, inflation data, Federal Reserve policy, geopolitical events and investor sentiment. Because the S&P 500 is market-cap-weighted, movements in its largest companies can have a huge impact. In the Dow, high-priced stocks carry more weight due to its price-weighted structure.
The S&P and the Dow can move in different directions because their calculation methods differ. The S&P 500 is market-cap-weighted, while the Dow is price-weighted. Also, the Dow includes just 30 companies, compared with the 500 tracked by the S&P. With such a smaller group, movements in one or two influential stocks can have an outsized impact on the Dow’s daily performance. Comparatively, the S&P 500’s broader base tends to reduce the effect of any single company, which can lead to different short-term results even when overall market trends are similar.
While you cannot invest directly in the S&P 500 or the Dow, you can invest in index funds (including mutual funds and ETFs) or individual stocks. You can open a brokerage account to get started.
Invest your way
Not working with us yet? Find a J.P. Morgan Advisor or explore ways to invest online.
Editorial staff, J.P. Morgan Wealth Management