January 2026: Gold surges, emerging markets tech leads and the US dollar eases

Global Investment Strategist

As we entered 2026, January wasted no time in delivering fresh geopolitical movement for markets to digest. January’s events helped fuel a rally for gold (+9%) despite its late-month reversal, which helped boost the Bloomberg Commodity Index (+10.4%) given gold’s approximately 14% weighting. Meanwhile, international equities’ (MSCI World ex-US: +5.9%) outperformance was driven partially by an Emerging Markets (EM) tech rally (+8.9%) and a modest weakening of the dollar, with the U.S. Dollar Index (DXY) down 1.3%. Regardless, the U.S. posted a strong month as the economy continued to show signs of resilience.
Risk assets start 2026 with solid returns in January
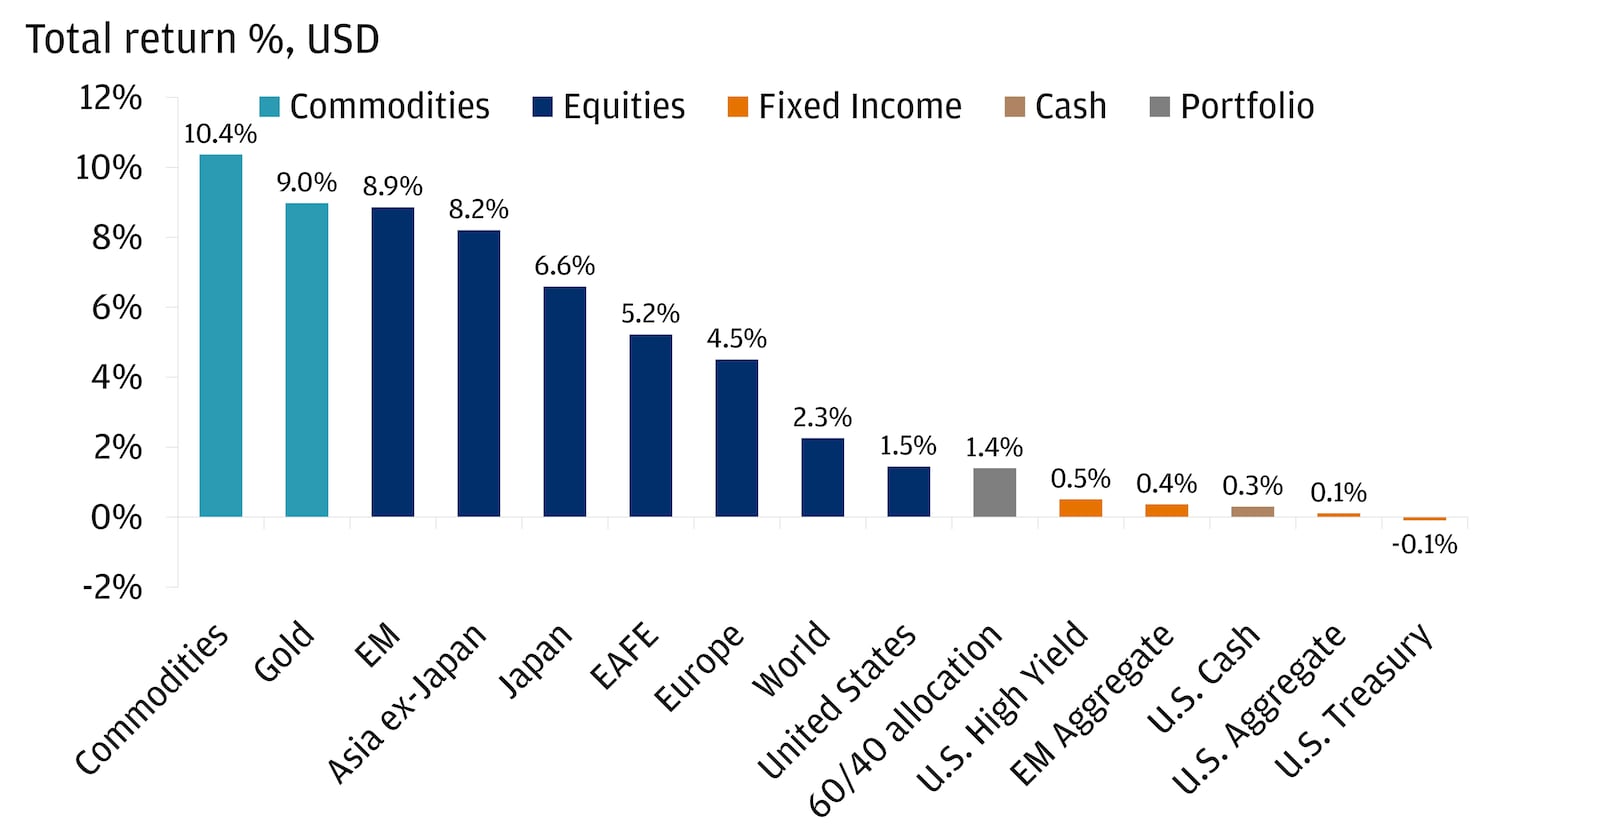
Source: FactSet. The indices shown in the chart are represented by : EM Equities: MSCI EM Index; Europe: Stoxx Europe 600 Index; Asia ex-Japan: MSCI AC Asia ex-Japan Index; EAFE: MSCI EAFE Index; World: MSCI World Index; Gold: NYMEX Near Term USD (Spot); U.S.: S&P 500 Index; Japan: MSCI Japan; U.S. Corporate HY: Bloomberg U.S. High Yield - Corporate Index; U.S. Agg Bonds: Bloomberg U.S. Aggregate Bond Index; EM Debt: Bloomberg EM Aggregate Bond USD Index; U.S. Treasury: Bloomberg Global U.S. Treasury Index; 60/40 Allocation: 60% MSCI World, 40% Bloomberg U.S. Aggregate Bond Index; Commodities: Bloomberg Commodity Index; U.S. Cash: Represented by the Bloomberg U.S. 1-3 Month Treasury Bills Index. The chart represents total returns from December 31, 2025 to January 31, 2026.
Let’s explore how these dynamics helped move portfolios in January.
Gold hits record highs, then plunges as hawkish Fed strengthens dollar
Driven by continued geopolitical tensions, gold built on its largest annual gain since 1979 and rallied 9% in January. However, the boost was interrupted in the final trading days of the month by one of gold’s steepest one-day declines in history.
This reversal can be partially attributed to investors taking profits as gold hit fresh record highs in late January along with President Donald Trump’s nomination of Kevin Warsh to lead the Federal Reserve (Fed), which generally is seen as a “hawkish” pick. To illustrate, Warsh is expected to favor higher interest rates to help keep inflation in check. Additionally, a more hawkish Fed could provide support for the U.S. dollar (USD), since higher rates can make U.S. debt more attractive to investors. Considering that gold is priced in dollars globally, a stronger USD can put downward pressure on gold prices as the metal becomes more expensive for overseas buyers, potentially weighing down demand.
Despite the late-month pullback, gold continued to demonstrate its ability as a potential portfolio diversifier against geopolitical events. The metal rallied as the U.S. increased its intervention in foreign affairs, including a military operation in Venezuela that captured President Nicolás Maduro and his wife, Cilia Flores. The White House also increased rhetoric about acquiring Greenland while threatening tariffs on NATO allies opposed to the U.S. acquisition of the Arctic territory. As a result, the uncertainty stemming from these events could prompt investors to look to gold as a potential safe-haven asset.
Gold is a top performer as a tactical portfolio hedge against geopolitical risk
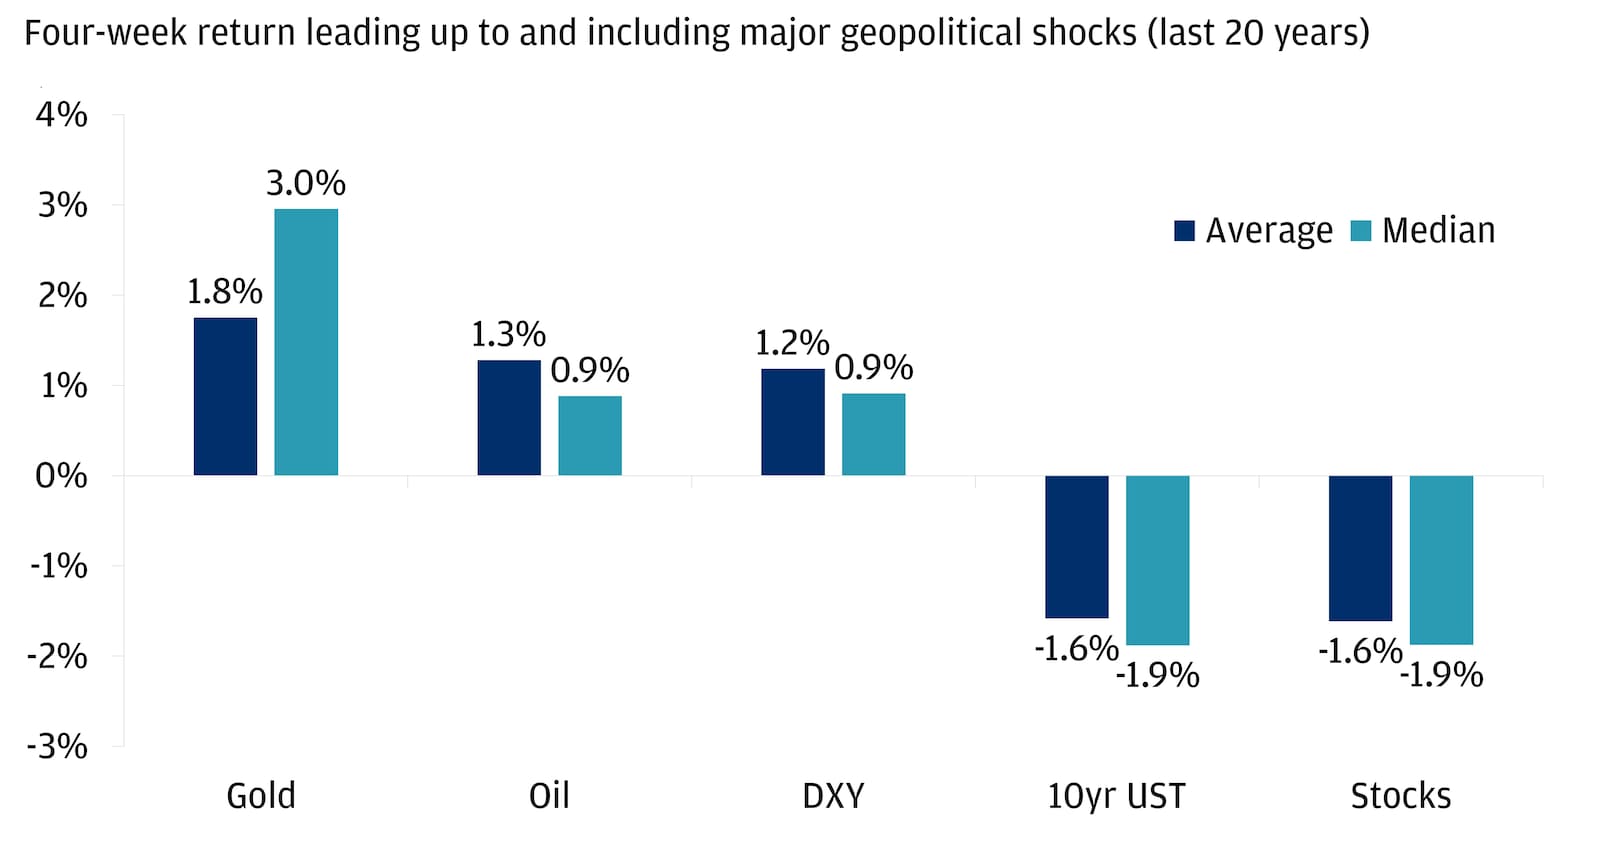
Sources: Dario Caldara and Matteo Iacoviello, J.P. Morgan Private Bank, Bloomberg Finance L.P., Haver Analytics. Data as of April 30, 2024. Note: The timeframe of the analysis goes from January 1985 to April 2024. We used the Geopolitical Risk (GPR) Index to isolate geopolitical shocks where its standard deviation is greater than 2. For consecutive series of data points exceeding 2 standard deviations, we only take into account the first data point. This analysis is based on average weekly data. DXY stands for the U.S. Dollar Index, whereas we used S&P 500 Total Return for stocks. 10yr UST stands for 10-year U.S. Treasury Bond total return. We used prices/price returns for gold, oil and DXY.
Ready to take the next step in investing?
We offer $0 commission online trades, intuitive investing tools and a range of advisor services, so you can take control of your financial future.
AI-fueled EM rally and softer USD power international equity gains
International equities across the board outperformed in January, led by EM. The artificial intelligence (AI) investment cycle, and especially the strong chip demand in Korea and Taiwan, continued to drive this strong EM performance.
Select regions, like Europe, got a boost from a modest weakening of the USD. In January, the USD fell to its lowest level in four years and posted its largest weekly depreciation since “Liberation Day.” This can be attributed to a few factors, including shifting expectations for Fed interest rate cuts, a looming partial U.S. government shutdown and headlines surrounding geopolitics and trade uncertainty.
When investors expect lower interest rates or see increased uncertainty around U.S. policy and global events, they may move money out of the dollar and into other currencies or assets, which can cause the dollar’s value to fall. A weaker dollar can boost returns for U.S. investors holding international assets, as gains in stronger foreign currencies translate into higher dollar returns. Investors saw this play out in January: As the euro rose relative to the dollar, USD-based investors of European equities saw an extra boost to their returns (+4.5% in USD terms vs. +3.2% in local currency).
Worst week for U.S. dollar since “Liberation Day”
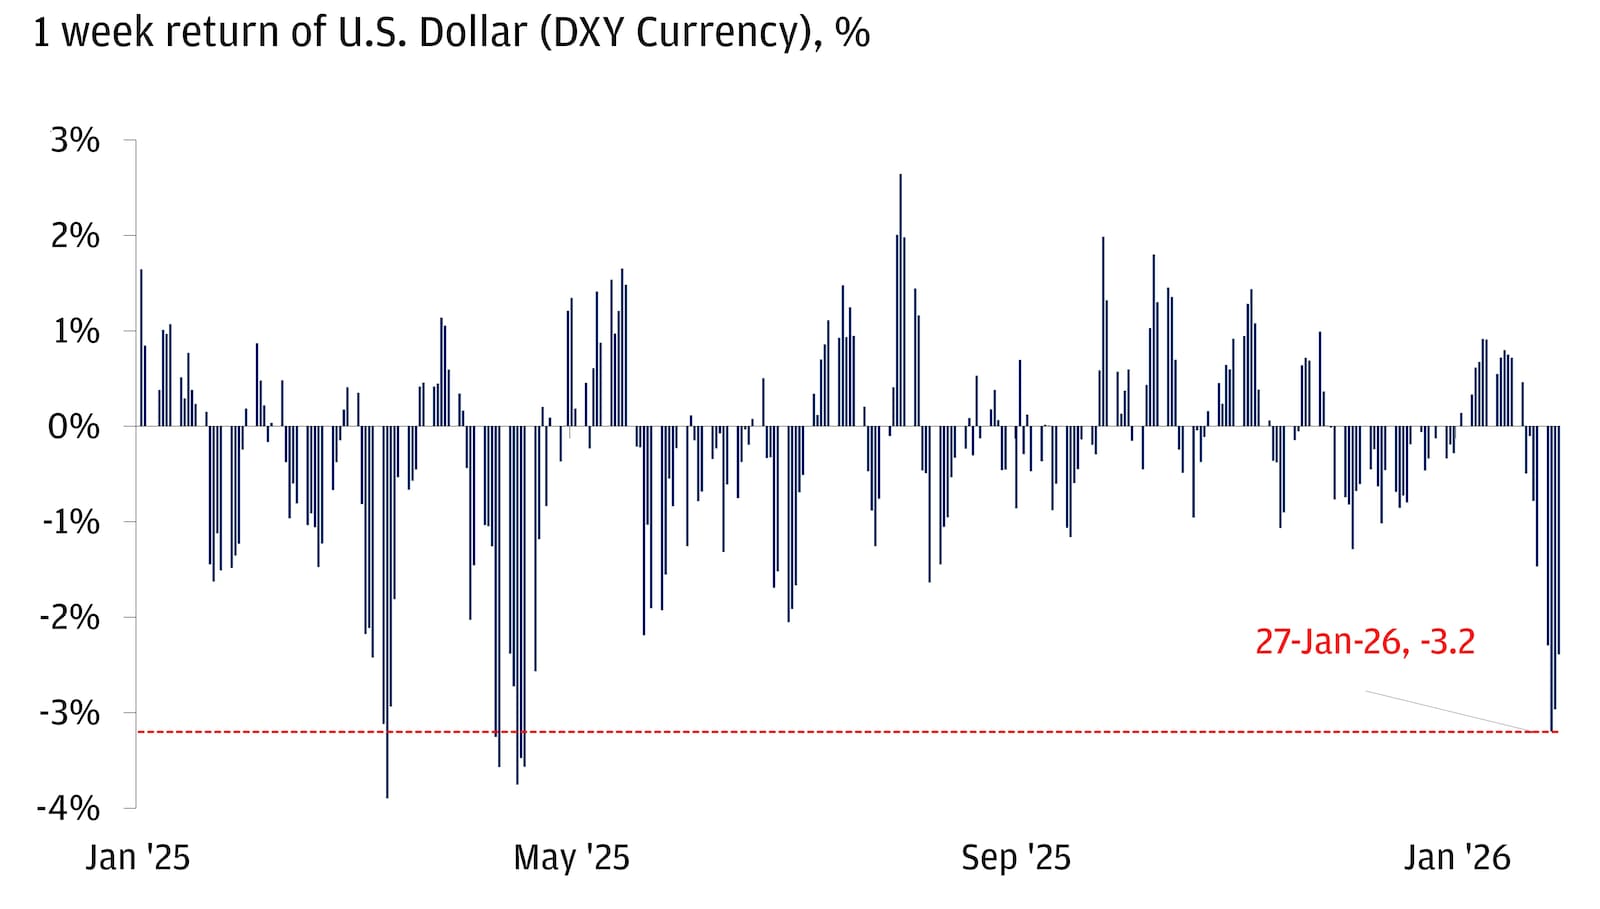
Source: Bloomberg Finance L.P. Data as of January 29, 2026.
Our outlook is that the USD could stabilize near current levels this year, though the process may be bumpy.
“Sell America” fears fade as US equities rise and USD dips modestly
The combination of a softer dollar and renewed U.S. policy uncertainty helped reignite talk of the “Sell America” trade in January – a scenario where the USD and U.S. equities decline, and Treasury yields jump simultaneously. This likely reminded some investors of last spring, when tariff announcements triggered a sharp, broad-based sell-off: The dollar dropped nearly 6%, the S&P 500 fell over 12% and long-term Treasury yields jumped by 40 basis points following the announcement.
But we believe this time is different, as market moves were comparatively muted – investors saw a more modest decline of the dollar, a rising of the S&P 500 and only a small uptick in 30-year Treasury yields. While headlines may have sounded similar, the actual market reaction was far different than last year; as we discussed in a recent “Top Market Takeaways,” we believe the U.S. continues to be a high-conviction investment opportunity and that January’s events are not a reason to “sell America.”
The U.S. economy continues to show signs of strength as the labor market showed signs of improvement, and the first glimpse into corporate America’s Q4 earnings has exceeded expectations. Rather than causing outright sales of U.S. assets, these developments have led international assets to receive the lion’s share of inflows, supporting a “buy less America” thesis rather than a “sell America” story.
The bottom line
January’s events have not altered the fundamental forces shaping our investment landscape – instead, they’ve reinforced the framework we laid out in our 2026 Outlook: Promise and Pressure. The promise comes from potential innovation and productivity, especially in the AI sector, and the opportunities created by a rapidly evolving world. The pressure, on the other hand, is felt in the form of persistent global fragmentation and policy uncertainty, both of which seem to have staying power for the time being. Nevertheless, a J.P. Morgan advisor is here to help you stay focused on the long term and ensure your portfolio is positioned based on your investment goals and risk tolerance.
You're invited to subscribe to our newsletters
We'll send you the latest market news, investing insights and more when you subscribe to our newsletters.
Global Investment Strategist