How are the S&P 500, Nasdaq and Dow performing so far? Stock market returns 2026 compared with 2025

Editorial Staff, J.P. Morgan Wealth Management
- All three major U.S. stock indexes have hit fresh record highs in 2026, but they’re not moving in lockstep: The S&P 500, Nasdaq and Dow track different mixes of companies and are built differently.
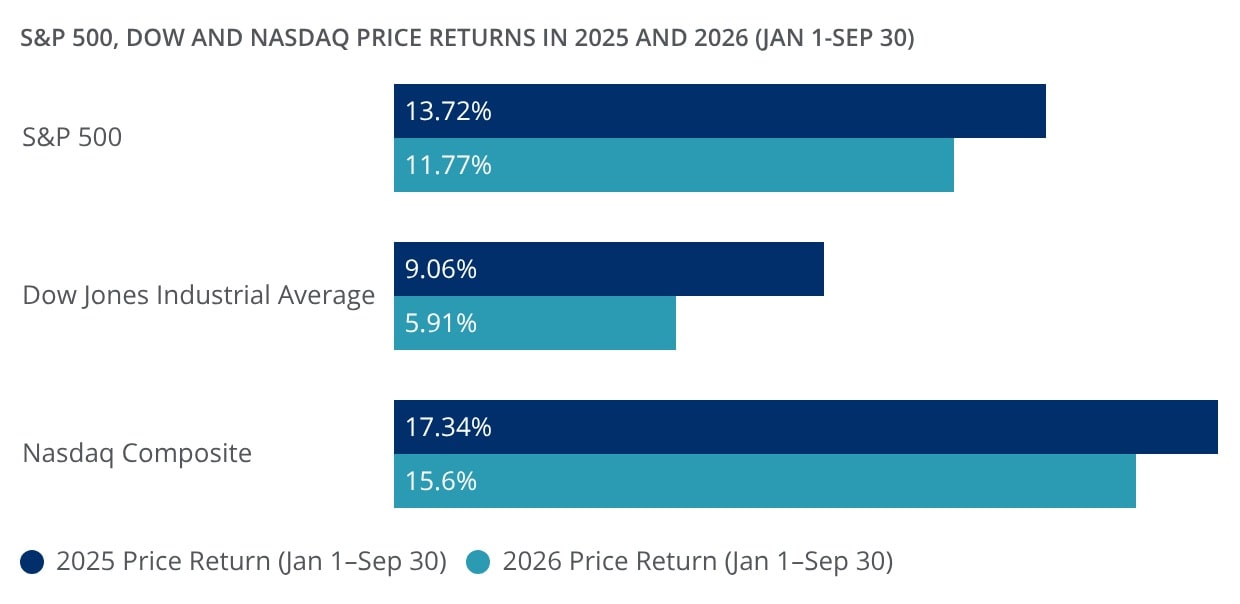
- The S&P 500 and Nasdaq posted strong year-to-date (YTD) gains of roughly 11.8% and 15.6%, respectively, while the Dow has had a more modest gain of about 5.9% through September 30, 2026.
- This year’s market performance has been influenced by interest rates and bond yields, energy prices tied to geopolitical tensions, and corporate earnings – including AI-related strength.
- Looking at 2026 returns as of September 30 and comparing those returns with how the market performed in 2025 can help frame what’s happened recently, but investors may be better served focusing on diversification, time horizon and sticking to a plan.

The stock market in 2026 has given investors a lot to react to – changes in rate expectations, inflation and growth signals, and earnings momentum can all influence stock prices. As a result, many investors may be looking for a straightforward read on how the biggest U.S. stock benchmarks are doing so far this year.
All three major U.S. equity indexes have continued to rally in 2026, hitting new record highs in recent months. So far this year, the S&P 500 and the Nasdaq have both gained double digits through September 30, while the Dow Jones Industrial Average (Dow) has seen more modest gains.
Looking at returns side by side – 2026 through September 30 compared to 2025 through September 30, as well as versus 2025’s full-year performance – can add context to the headlines and help frame what’s happened recently against last year’s market backdrop.
Here’s how the stock market has performed so far in 2026, what has played a role in that performance and what investors may want to consider going into the end of the year.
Stock market snapshot: 2026 year-to-date returns vs. 2025
U.S. stocks have continued to climb in 2026, building on strong gains in 2025. Through September 30, 2026, all three major U.S. equity indexes are higher for the year: The Dow Jones Industrial Average is up 5.9%, the Nasdaq Composite is up 15.6%, and the S&P 500 is up 11.8%.
Those gains have come alongside new milestones. The Dow set its all-time record closing high of 54,349.12 on August 5. The S&P 500 notched its most recent record on August 13, closing at 7,798.99 points. And the Nasdaq Composite reached a new record closing high of 27,244.28 on September 22.
Stock markets continue to move higher in 2026, but at a slower pace than last year
Past performance is no guarantee of future results. It is not possible to invest directly in an index.
Looking at an apples-to-apples comparison, returns through September 30, 2025, were slightly higher than they are through the same point in 2026. For that same period last year, the Dow was up 9.1%, the Nasdaq Composite was up 17.3%, and the S&P 500 was up 13.7%.
And the market’s pace this year has been somewhat slower than last year’s. In 2025, the Dow rose 12.97% for the full year, while the Nasdaq Composite gained 20.36% and the S&P 500 climbed 16.39%.
To put this into context, the market is by no means in dire straits, with major index returns in 2026 either nearing or surpassing historical averages. For instance, the S&P 500 has historically posted an average annual total return of 10%.
What each index measures (and why performance can diverge)
The stock market is often talked about as if it’s a single scoreboard, but the S&P 500, Nasdaq and Dow all track different baskets of companies – and they don’t all calculate performance the same way. That means it’s normal to see gaps between their returns, even when U.S. stocks are broadly moving in the same direction.
The S&P 500 is widely viewed as the best single snapshot of large U.S. companies. It includes 500 of the largest publicly traded U.S. firms and is designed to represent a broad cross-section of the equity market.
The Nasdaq Composite is a broad index of stocks listed on the Nasdaq exchange, but in practice it tends to have a heavier tilt toward technology and other growth-oriented sectors than the S&P 500 or the Dow. That sector mix matters because growth-heavy areas of the market can be especially sensitive to shifts in interest rates and investor expectations about future earnings.
The Dow is made up of 30 large, well-known U.S. companies, but it’s constructed differently from the other two. The Dow is a price-weighted index, meaning companies with higher share prices have a bigger influence on the index’s moves – even if a lower-priced company is larger by market value. In plain terms, a big percentage move in one high-priced Dow stock can have an outsized impact on the index, which can make the Dow behave differently than broader, market-capitalization-weighted benchmarks.
Because of those structural differences, performance can diverge depending on what part of the market is driving returns. When technology and other growth stocks are leading, the Nasdaq Composite often has more upside than the other two. When more traditional value areas – such as industrials, financials or dividend-paying blue chips – are in favor, the Dow may look comparatively stronger. And when gains are spread more broadly across sectors and industries, that tends to show up more in the S&P 500’s results.
Get up to $1,000
When you open a J.P. Morgan Self-Directed Investing account, you get a trading experience that puts you in control and up to $1,000 in cash bonus.
What’s driving stock market performance in 2026 so far
A big driver in 2026 has been interest rates – and how long borrowing costs may stay elevated. The Federal Reserve raised interest rates by a quarter percentage point at its September meeting, lifting the benchmark federal funds rate to a target range of 3.75% to 4.00%. It was the central bank’s first rate hike in more than three years, and policymakers have suggested at least one more hike could still be in the cards for 2026.
Markets have also had to digest a backdrop of higher bond yields, with the U.S. 10-year Treasury yield surpassing 5.293% on September 30, a level not seen since the global financial crisis. In plain terms: Higher yields can be a headwind for stocks because they can cool spending and investment – and because stock valuations often have a harder time expanding when yields are rising.
Inflation and energy prices have been another major swing factor. Starting in early September, the price of oil once again traded above $100 per barrel, amid concerns over potential supply disruptions due to the ongoing conflict with Iran. When energy prices climb, investors often worry that inflation could prove more stubborn, which complicates the outlook for interest rates.
At the same time, corporate earnings have provided real fundamental support for stocks, especially in the S&P 500. The benchmark index posted its seventh consecutive quarter of double-digit earnings growth in the second quarter of 2026, continuing a solid run that has helped push the stock market higher. Finally, sector leadership has also mattered – particularly within technology and areas of the market linked to artificial intelligence (AI), which have been a key driver of earnings momentum.
Here are a few things investors may be watching next:
- Upcoming Fed meetings and any changes in the projected path for rates
- Key inflation releases and how energy prices may be feeding through
- The next earnings season, including whether AI-related strength broadens or narrows
- Ongoing geopolitical developments that could affect energy supply routes and inflation expectations
The bottom line
Stocks have moved higher again in 2026, but the market’s gains so far are still behind last year’s full-year run. Through September 30, 2026, the S&P 500 is up 11.8%, the Nasdaq Composite is up 15.6% and the Dow is up 5.9%. In 2025, for that same time period, those indexes were up 13.7%, 17.3% and 9.1%, respectively. Markets have a bit more work to do in the months ahead if 2026 is going to surpass last year’s returns.
For investors, the more important question is what to do with that information. One helpful starting point is to remember that these indexes aren’t interchangeable: They hold different mixes of companies and weight them differently, so it’s normal for returns and risk to vary.
That’s why it can help to keep performance in the context of a plan. Staying diversified – across sectors and styles, and potentially beyond stocks depending on your goals – can reduce the odds that your results depend on a single corner of the market. And rebalancing, as a discipline, is one way investors often keep a portfolio aligned with the intended risk level over time, rather than letting market moves quietly change the mix.
Finally, it may be worthwhile being cautious about letting recent highs dictate the next decision. Markets can shift quickly, and short-term performance doesn’t always continue. Keeping your time horizon and risk tolerance front and center may make it easier to stay invested through the inevitable ups and downs.
Invest your way
Not working with us yet? Find a J.P. Morgan Advisor or explore ways to invest online.