Why global equities retreated in June despite gradual Middle East de-escalation

Global Investment Strategist

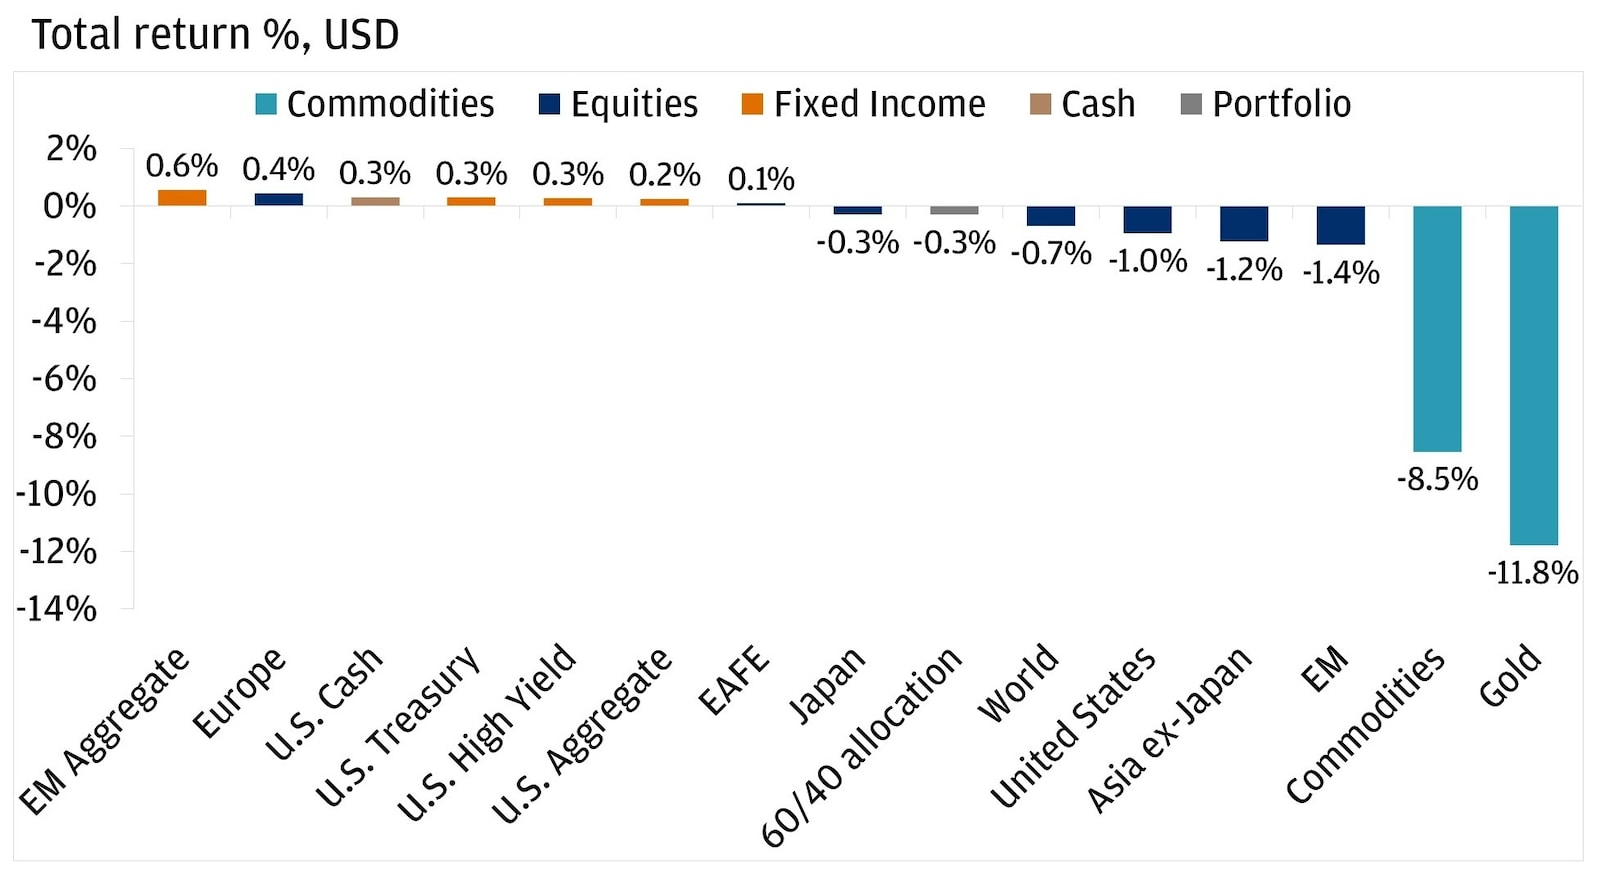
Following back-to-back months of equity gains, investors experienced a reversal in June, with most major equity markets giving back ground (MSCI World -0.7%, U.S. -1.2%, emerging markets -1.4% and Europe +0.4%). Simultaneously, fixed-income returns were slightly positive (emerging market debt +0.6, U.S. Treasuries +0.3%), and gold (-11.8%) delivered its worst monthly performance since 2013.
The market moves investors experienced in June were driven primarily by discussions of a U.S.-Iran memorandum of understanding (MOU), a new Federal Reserve regime introducing a hawkish tone and a healthy rotation out of big U.S. tech.
Most major equity regions pulled back in June
Below, we discuss how these developments impacted markets in June and what they could mean heading into the second half of the year.
Middle East conflict: Lower oil prices as conflict fades
Following several months of geopolitical tensions and uncertainty, and a global energy supply shock amplified by constrained traffic through the Strait of Hormuz – a critical choke point for nearly 20% of the world’s oil and liquefied natural gas (LNG) trade – the U.S. and Iran reached a Memorandum of Understanding (MOU) in June aimed at ending hostilities and reopening the strait. The agreement included a 60-day toll-free period for vessels.
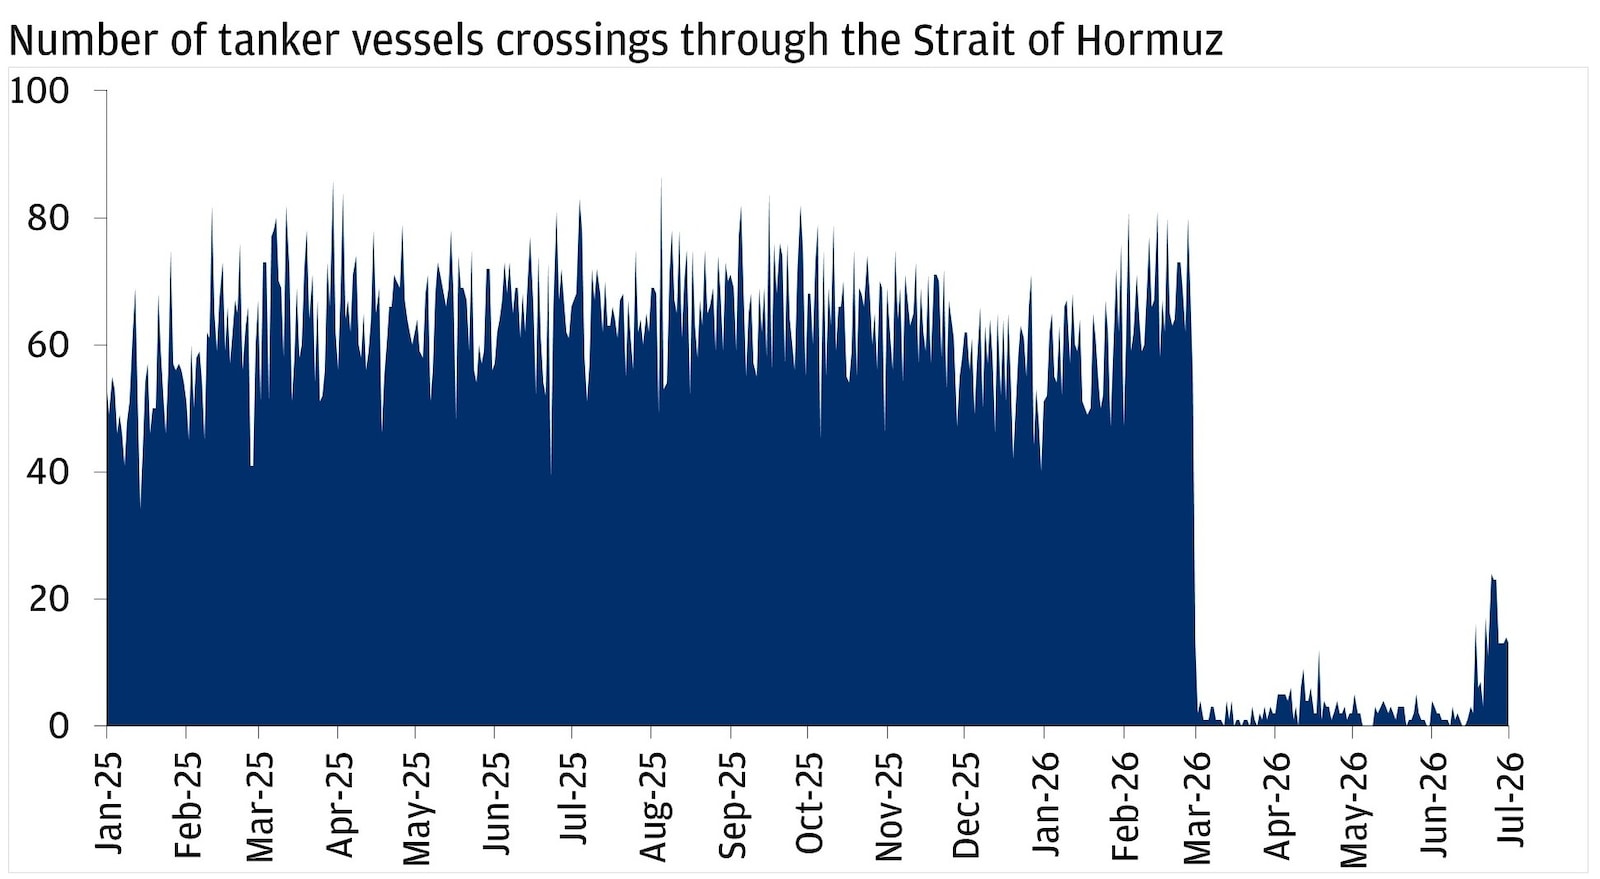
While there’s been a modest recovery of tanker crossings, flows have yet to normalize to pre-conflict levels. Still, shipping activity improved enough to produce a conflict-era record of roughly 24 vessels in a single day in late June. Oil prices responded quickly as the geopolitical shock began to unwind, with Brent crude falling below $80 per barrel for the first time since March and ending the month near the low-$70s.
Strait of Hormuz vessel crossings picking back up
Even if shipping takes time to normalize, lower oil prices could be a meaningful pressure release valve for inflation and household budgets. Energy accounted for approximately 60% of the recent increase in headline inflation. If oil prices remain low, inflation could gradually cool as energy feeds through to headline readings.
At the same time, the reopening is not without risk. Iran has emphasized a “strategic control” of the strait, and shipping conditions could still shift quickly. A key signal to watch is the durability of the reopening of the strait and how quickly supply is hitting global markets.
Ready to take the next step in investing?
We offer $0 commission online trades, intuitive investing tools and a range of advisor services, so you can take control of your financial future.
A new Federal Reserve regime with a hawkish tone
With the conflict shock continuing to fade and oil prices diving lower, investor attention quickly shifted to the Federal Reserve and what policy could look like under new Chair Kevin Warsh. As widely expected, the Fed held rates steady at 3.50%–3.75% at the June meeting. What mattered more for markets was the change in communication and reaction function. Under Warsh, the Fed is planning to step back from providing forward guidance, which signals where central bank officials think policy might go next, and lean heavily into an explicit data-driven approach. For investors, that could translate into a less predictable policy path.
Markets interpreted Warsh’s first press conference as more hawkish, because it seemingly signaled a higher bar for future rate cuts and a greater willingness to keep policy steady or hike, as he emphasized that his key focus is on maintaining price stability.
Despite the hawkish repricing, we think market expectations may be leaning too far. Our base case currently remains that the Fed stays on hold this year. As mentioned above, energy has been a dominant driver of the recent inflation pickup, and the sharp drop in oil may not yet be fully reflected in the outlook.
These “higher for longer” interest rate expectations can also help explain why June was such a difficult month for gold. Given that the metal is a nonyielding asset, when interest rates (and real yields) are expected to rise, the opportunity cost of holding gold tends to increase. Technical dynamics likely added pressure as gold fell below its 200-day moving average. Importantly, we don’t think the recent weak performance negates gold’s potential role in a well-constructed portfolio. We continue to view gold as a potential strategic diversifier, when sized appropriately, because its drivers can differ from stocks and bonds across various market regimes.
A healthy U.S. equity rotation
A late-month rebound helped limit June’s S&P 500 decline, but a notable story was how the market got there. Leadership broadened as two of the index’s biggest drivers – Communications Services (-4%) and Information Technology (-7%) – fell, while several other sectors held up well or moved higher, including Health Care (+8.5%), Financials (+7.3%), Industrials (+7.8%) and Utilities (+4.5%). In other words, June looked less like a broad “risk-off” move and more like a rotation away from the most crowded leadership.
For investors, the pullback is a practical reminder that diversification can be an effective risk management tool in portfolios. When returns are driven by a narrow group of leaders, portfolios can potentially start to behave like a “single theme bet” even if that wasn’t the intention. Incorporating a broad mix of sectors, regions and asset classes can potentially help smooth the ride when leadership changes quickly.
Despite the monthly loss, the second quarter of 2026 was impressive. The S&P 500 rallied nearly 15% for its best quarter in six years. Looking ahead, we continue to have a positive view on U.S. equities over the next 12 months, with earnings expected to provide a source of broad market support. Six of the eleven S&P 500 sectors are expected to deliver double-digit earnings growth in the second quarter.
June’s message for investors
June 2026 could serve as a reminder that markets don’t solely move on “good news” or “bad news,” but they can also move on what changes versus what was already priced in. As we move into the second half of the year, three big questions for investors will likely be whether tanker traffic through the strait continues to normalize, how Fed policy evolves and whether a broad range of companies can continue to deliver impressive earnings results.
Our base remains constructive, but June sent a message that leadership can change quickly – and diversified portfolios are built for exactly that. Your J.P. Morgan Wealth Management advisor can help ensure your portfolio remains best aligned with your goals and risk tolerance as markets evolve.
You're invited to subscribe to our newsletters
We'll send you the latest market news, investing insights and more when you subscribe to our newsletters.