Inflation in the first half of 2026: Why are prices still high?

Editorial staff, J.P. Morgan Wealth Management
- Inflation was up 4.2% year over year in May, according to the latest Consumer Price Index (CPI) report. That’s 0.4 percentage points higher than April’s reading of 3.8% annual inflation, showing that prices have continued to climb since last year.
- The latest annual inflation rate is primarily driven by rising energy, oil and gas prices that began in March with the onset of the Iran conflict.
- Core CPI, which removes volatile food and energy prices, was 2.9% in May year over year and 0.2% month over month – still higher since last year but down month to month from April’s reading.
- In the first half of 2026, annual inflation has remained well above the Federal Reserve (Fed) goal of 2%. Since January, annual inflation has increased 1.8% percentage points, and monthly inflation has more than doubled.

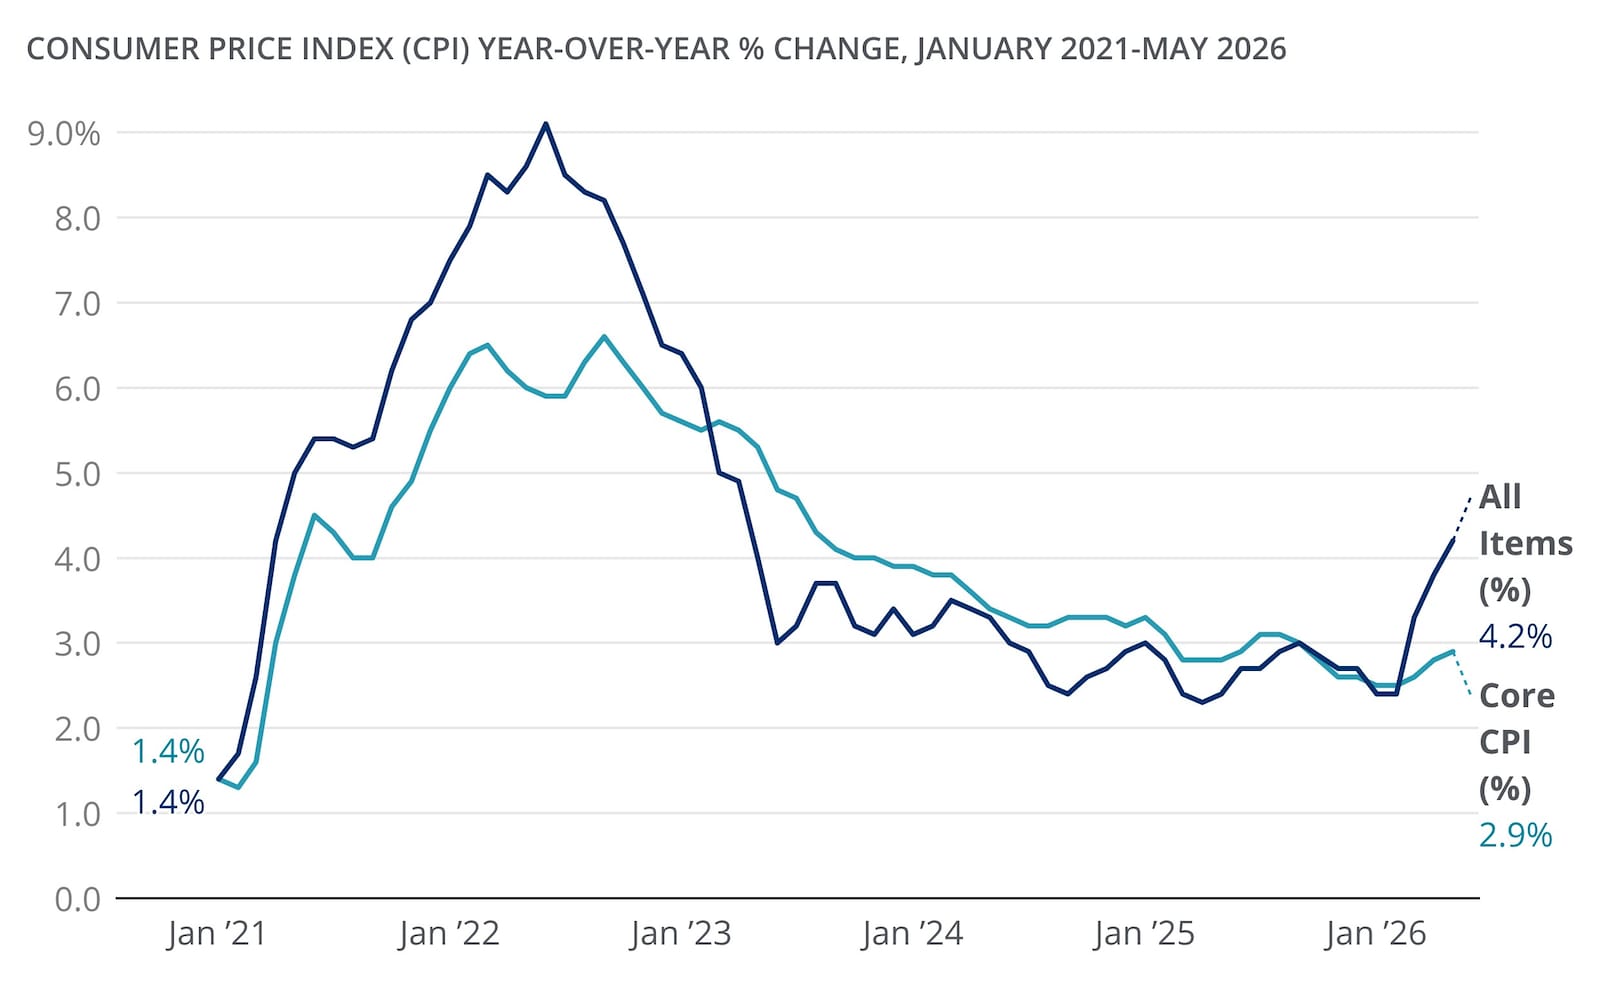
Inflation has been high in the first half of 2026. The latest Consumer Price Index (CPI) report shows that year-over-year (YoY) inflation was up 4.2% in May 2026 – in line with expectations but the highest it’s been in three years. That’s a difference of 1.8% percentage points from January’s 2.4% (before the conflict in Iran began).
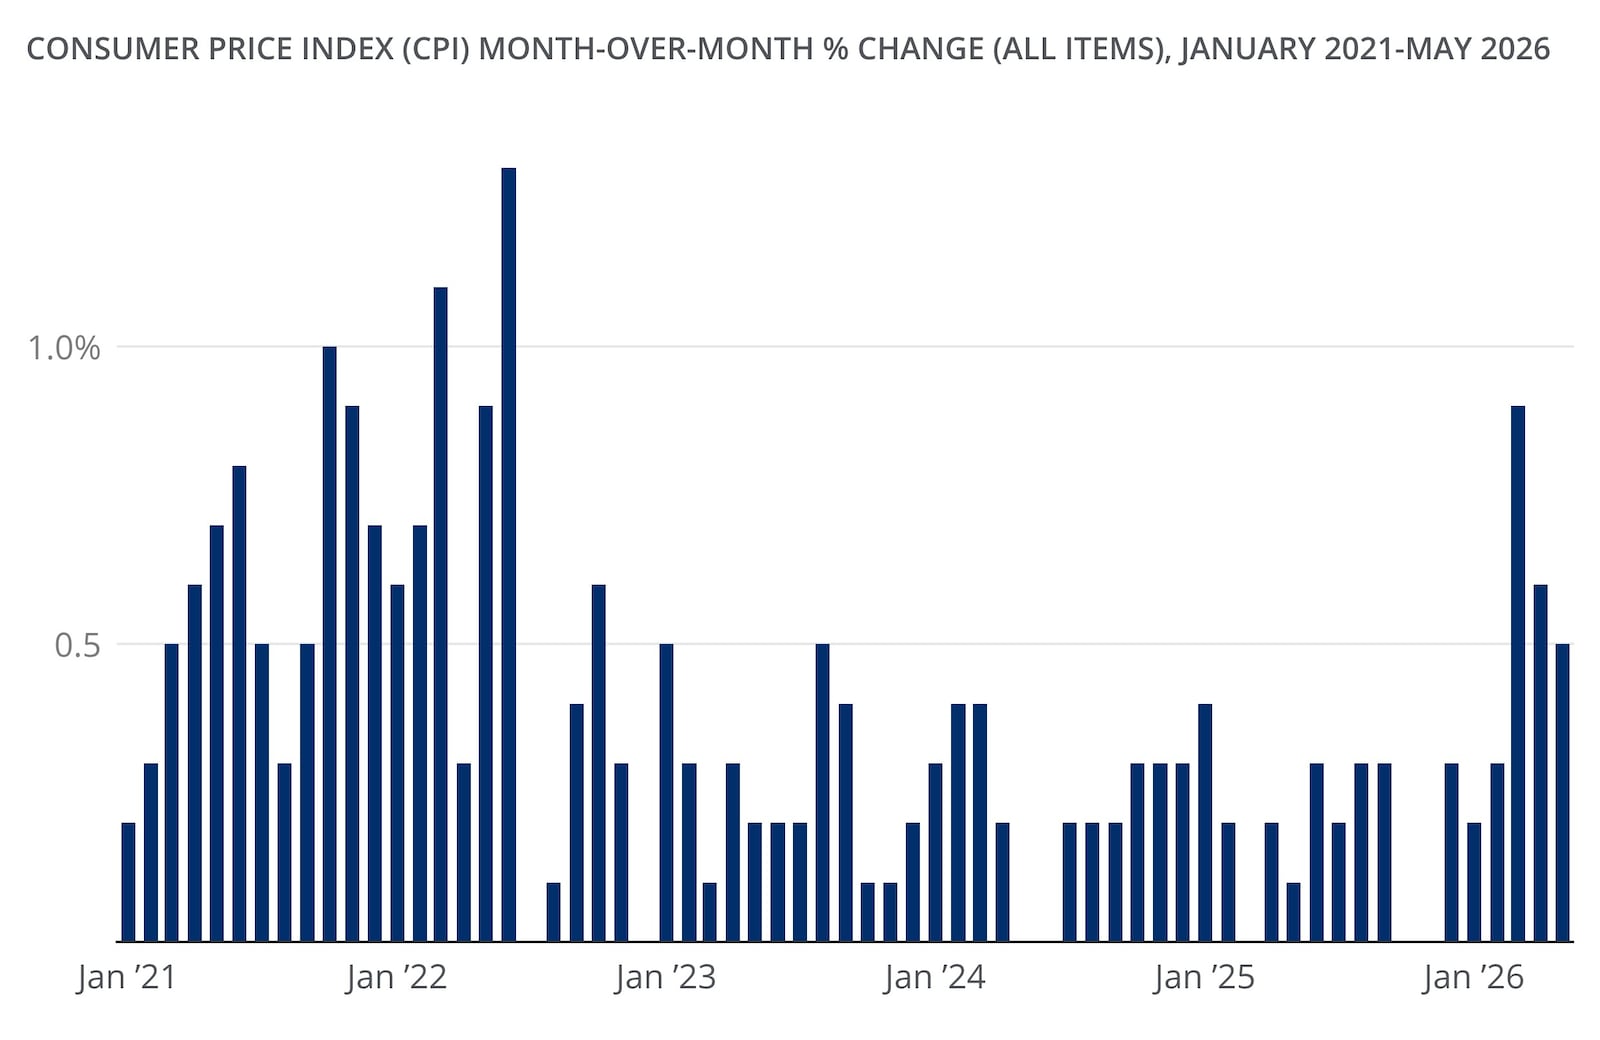
Price pressures broadened over the past six months, and month-over-month (MoM) inflation also rose 0.5% in May, 0.1 percentage points lower than in April though still more than double what it was in January.
Inflation in 2026 can now largely be attributed to volatile energy shocks impacting oil and gas prices, as well as sticky prices for core categories like shelter. In May, fuel oil was up 58.9% year over year, while gasoline prices were up 40.5% since last year. Shelter was up 3.4% from May 2025.
When you strip out energy and food prices, core CPI shows that annual inflation was 2.9% in May, up from April’s annual reading but 0.2% month over month, retreating from 0.4% the month prior.
“Inflation has been a trademark of 2026 and the entire post pandemic cycle,” J.P. Morgan Wealth Management Chief Investment Strategist Phil Camporeale said. “While energy prices have driven ‘headline inflation’ higher, we believe this is more indicative of a Fed on hold versus tightening. Our expectation is that energy prices will peak in Q2, limiting the impact on core prices in the second half of the year. The muted reaction in Treasury rates after the CPI report validates that this is a supply driven inflation shock versus an overheating demand driven economy.”
2026 inflation year-to-date
The CPI tracks the prices consumers pay for a basket of goods and services. Headline CPI includes everything in the basket, while core CPI excludes food and energy since those categories can swing sharply from month to month. The Fed’s goal is to keep inflation at a target rate of 2% year over year. The Fed prefers Personal Consumption Expenditures (PCE) to track inflation, but CPI is the more commonly used metric to gauge how consumers’ out-of-pocket spending has changed over time.
YoY inflation compares prices with those in the same month one year earlier, while MoM inflation shows more recent changes. The distinction matters because YoY inflation can remain elevated even if MoM price increases start cooling.
While CPI can be a helpful gauge, it’s important to realize that the number is not equivalent to every household’s personal inflation rate. For example, people who drive more, rent in a high-cost market or spend more on groceries may experience price changes that deviate from the national weighted average.
2021-2026 year-over-year inflation rates, by month
2021-2026 month-over-month inflation rate, by month
Get up to $1,000
When you open a J.P. Morgan Self-Directed Investing account, you get a trading experience that puts you in control and up to $1,000 in cash bonus.
Why has inflation been so high in 2026?
The top drivers of inflation in 2026 include:
- Shelter
- Energy and gas
- Transportation and medical costs
- Wage dynamics
- Base effects
Let’s dig deeper into each one.
Shelter
Shelter is one reason core inflation can be sticky rather than falling quickly – and it matters because shelter is the biggest component of the CPI basket. CPI’s shelter measure is based largely on rent-related data, which reflect housing costs across a broad stock of households, not just newly signed leases.
Because rents often adjust in steps (frequently when leases reset) and rent data is collected over time across many units, shifts in housing market conditions typically show up in CPI gradually and with a lag, which can keep core inflation elevated even after other categories cool.
In May, the shelter index rose 0.3% from April and 3.4% from a year earlier, which helped keep core inflation elevated from 2025.
Energy and gas
It comes as no surprise that energy was the biggest driver of headline inflation. The BLS reported all energy costs up 23.5% year over year in May, with gasoline up 40.5% and fuel oil up 58.9%. In April, gas was up 28.4% and fuel oil was up 54.3%.
Since the Iran conflict began and the Strait of Hormuz was effectively closed, global energy prices have skyrocketed. To put this in perspective, the national average price of one regular gallon of gas was $4.15 on June 10, 2026, up from $3.12 this time last year, according to AAA. This figure alone represents a roughly 39% increase in the national average price of regular gas since the start of the war in late February.
Transportation and medical costs
Some service categories remain noticeable to consumers because they can reflect a mix of labor, repair, replacement, administrative and financing costs. In May, transportation services were up 4.1% from a year earlier, slightly down from April’s annual increase but still elevated, largely due to higher airfare prices that reflect price spikes for gas and oil. However, month over month, transportation services declined 0.6%, primarily driven by auto insurance declines. Medical care services rose 3.6% since May 2025, and prices were up 0.5% since last month, reversing March and April’s readings of 0.0% inflation.
Wage dynamics
Wage growth matters for inflation – especially core inflation – because it reflects labor supply-and-demand conditions and feeds into prices through two channels. For many service businesses, labor is a large share of costs, so higher wages can influence pricing and margins. At the same time, higher wages can support household discretionary spending, affecting demand for services. In that context, Federal Reserve Vice Chair Phillip Jefferson’s remarks in February 2026 at a Brookings Institution event stating that workforce dynamics seem to be normalizing align with what we’ve been seeing in the data: labor conditions appear to be stabilizing alongside moderating wage growth, which should help limit renewed wage-driven inflation pressure.
Base effects
YoY inflation compares today’s prices with where they were a year ago. When energy prices are being pushed around by Middle East tensions, the “base” from last year can be unusually high or low – so the annual inflation rate can look firm even if recent month-to-month inflation has cooled. If those geopolitical pressures ease and energy prices eventually normalize or fall, that can create more favorable year-ago comparisons next year, helping YoY inflation look lower.
What changed month to month in 2026
Based on BLS data available through May, the lowest headline annual CPI reading was 2.4% in January and February, and the highest was 4.2% in May. At the same time, the lowest annual core CPI rate was 2.5% in January and February, and the highest was 2.9% in May.
May’s high numbers were driven more by headline inflation than core inflation. Indeed, energy and gasoline rose sharply, contributing significantly to the spike. Still, core CPI also increased, which suggests some stickier categories were adding pressure below the surface.
MoM inflation has softened from its high in March, when it was 0.9%. In May, prices were only 0.5% higher than in April, driven by declines in medical care commodities (-0.7%), transportation services (-0.6%) and utility gas services (-0.5%). MoM transportation services prices showed the most significant cooling since the start of 2026, when they were up 1.4% from December.
What investors can keep in mind through the end of 2026
Sticky inflation tends to keep expected interest rates higher, because it suggests the Fed may need to hold rates up for longer – or tighten further – to bring inflation down. For the June 16–17 FOMC meeting, markets largely expect the Fed to leave rates on hold. Even so, investors may be focused on the signals around the decision – especially the Summary of Economic Projections (the Fed’s updated outlook for growth, inflation and rates), the wording of the statement and the vote split after an unusually divided April meeting with four dissents.
This meeting will also be closely watched because Kevin Warsh, who was sworn in as chair on May 22, is expected to hold his first press conference in the role. Investors are looking for any indication of the Fed’s next move as markets have been pricing in greater odds of a rate hike later this year.
At the same time, Treasury Secretary Scott Bessent recently shared that he anticipates prices may come down soon. Referencing Warsh in a May interview with CNBC, Bessent said, “I actually think he’s going to be in a very good position, because we may get a series of one or two more hot inflation numbers, but then I think we’re going to see substantial disinflation.”
When it comes to bonds, higher or stickier inflation can also keep rate expectations elevated. Longer-term securities tend to be more sensitive to rate changes because duration measures how much a bond’s price may move when interest rates shift. This risk has been visible in long-term Treasuries, with the 30-year Treasury yield reaching 5.197% on May 19, 2026 – a level not seen since July 2007, ahead of the 2008 financial crisis. On the morning of June 10, the 30-year yield was down from that high, sitting around 5.012%.
Short-term cash tools, such as high-yield savings accounts and certificates of deposit (CDs), may continue to offer attractive yields for now, but investors may want to consider reinvestment risk as rates could change later this year. Asset diversification can also be a crucial hedge against risk since inflation and rates can affect different sectors in different ways.
The behavioral rule is simple: Try to avoid overreacting to a single CPI report. In some cases, as in May 2026, a single month can be driven by a major spike in energy costs or in another category. Remember that the broader trend, the overall drivers and your financial plan matter more than a single headline number.
The bottom line
Inflation was high in the first half of 2026 because the annual headline rate accelerated from 2.4% in January and February to 4.2% in May, while core CPI also moved higher. Energy and gasoline were the most obvious drivers, but shelter and services also helped keep inflation up for U.S. households.
For investors, it often helps to focus on the trend line and the broader context, while staying anchored to a long-term plan, clear investment goals and healthy liquidity hygiene.
Invest your way
Not working with us yet? Find a J.P. Morgan Advisor or explore ways to invest online.
Editorial staff, J.P. Morgan Wealth Management