Markets
Check out the latest market news
Markets
What to expect at Kevin Warsh’s first Federal Reserve meeting as chair: 3 things to watch for when the FOMC meets in June The June FOMC meeting will be Kevin Warsh’s first as chair. His communication style and handling of the policy statement may offer early signals about how he plans to lead the Federal Reserve moving forward.By Hilarey Gould|6 min
Markets
What is the lipstick index?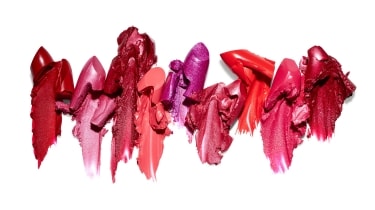 The lipstick index is an economic theory that when consumers perceive a recession is looming, sales for “affordable luxury” items such as lipstick increase. Read on to learn more.By Mary Mannion|2 min
Markets
Is the momentum trade over? With momentum dispersion at its widest since 1990, the summer calm could open the door for overlooked sectors. We examine where new leadership may emerge and what it may mean for positioning.By Kriti Gupta
Markets
Stock market returns for 2026: How are the S&P 500, Nasdaq and Dow performing so far? The S&P 500, Nasdaq and Dow hit several record highs between January and May 2026. So what’s behind the positive performance? And how do the three indexes compare in terms of gains?By Hilarey Gould|6 min
Markets
If the shock doesn’t stick: Mapping out de-escalation Markets remain priced for persistent risk, but if tensions with Iran ease, investors could rotate toward unloved and less-owned sectors and regions.By Kriti Gupta
Markets
How to get to 9,000 on the S&P 500 Explore the drivers behind the S&P 500’s historic rally and the potential for broader AI adoption to propel markets higher. Examine the risks and opportunities as markets adapt to shifting bond yields and a global repricing.By Kriti Gupta
Markets
The U.S.-China relationship: A new equilibrium Diminished uncertainty could curb shocks and sharpen China and emerging-market opportunities.By Federico Cuevas
Markets
Kevin Warsh is the new chair of the Federal Reserve: Here’s what that could mean for markets and investors in 2026 Kevin Warsh is the new chair of the Federal Reserve. Read on to learn about his background, what could change at the Fed and what investors might want to watch.By Hilarey Gould|7 min
Invest your way
From online investing to working with an advisor, J.P. Morgan is ready to help you achieve your goals.