Inflation, yields and equities: When does the pressure actually matter?

Global Investment Strategist

September’s CPI report was a reminder that the path back to 2% inflation remains uneven. Headline prices rose 0.6% on the month and 3.7% from a year earlier, with the annual measure one-tenth above consensus. Energy did much of the damage: Gasoline rose 9.1% and accounted for more than half of the monthly headline increase. The September PPI reinforced the signal: Producer prices rose 1.3% in September and 6.3% from a year earlier, with both significantly hotter than expected.
In response to CPI, the market initially followed the textbook: The 2-year yield rose and the curve bear-flattened – meaning yields rose across the curve, but shorter-term yields increased more than longer-term yields. Futures roughly doubled the implied probability of an October quarter-point Federal Reserve rate hike to the mid-40% range. But the move faded through the day. By Wednesday’s close, the Treasury sell-off had reversed and October hike odds had moved back below 30%.
Meanwhile, the S&P 500 was only slightly lower after CPI, then weakened as the session progressed and concerns about artificial intelligence (AI)-linked companies took over. That pressure continued despite the hot PPI print, while the Treasury curve has kept flattening – but from the other direction: Long-end yields have fallen more than front-end yields in a flight-to-safety move that began on Wednesday and extended into Thursday.
That is a strange cross-asset reaction to successive upside inflation surprises – but also a constructive one for diversified portfolios. Treasuries are showing that they can still hedge growth and equity-market concerns when the dominant risk shifts away from inflation. The bond rally does not mean inflation no longer matters; it means the market is currently more focused on the growth implications of the AI sell-off. The larger question is: Why has hotter-than-expected inflation done so little lasting damage to stocks? Even after the sell-off of the past two days, equities sit less than 2% below all-time highs.
Ready to take the next step in investing?
We offer $0 commission online trades, intuitive investing tools and a range of advisor services, so you can take control of your financial future.
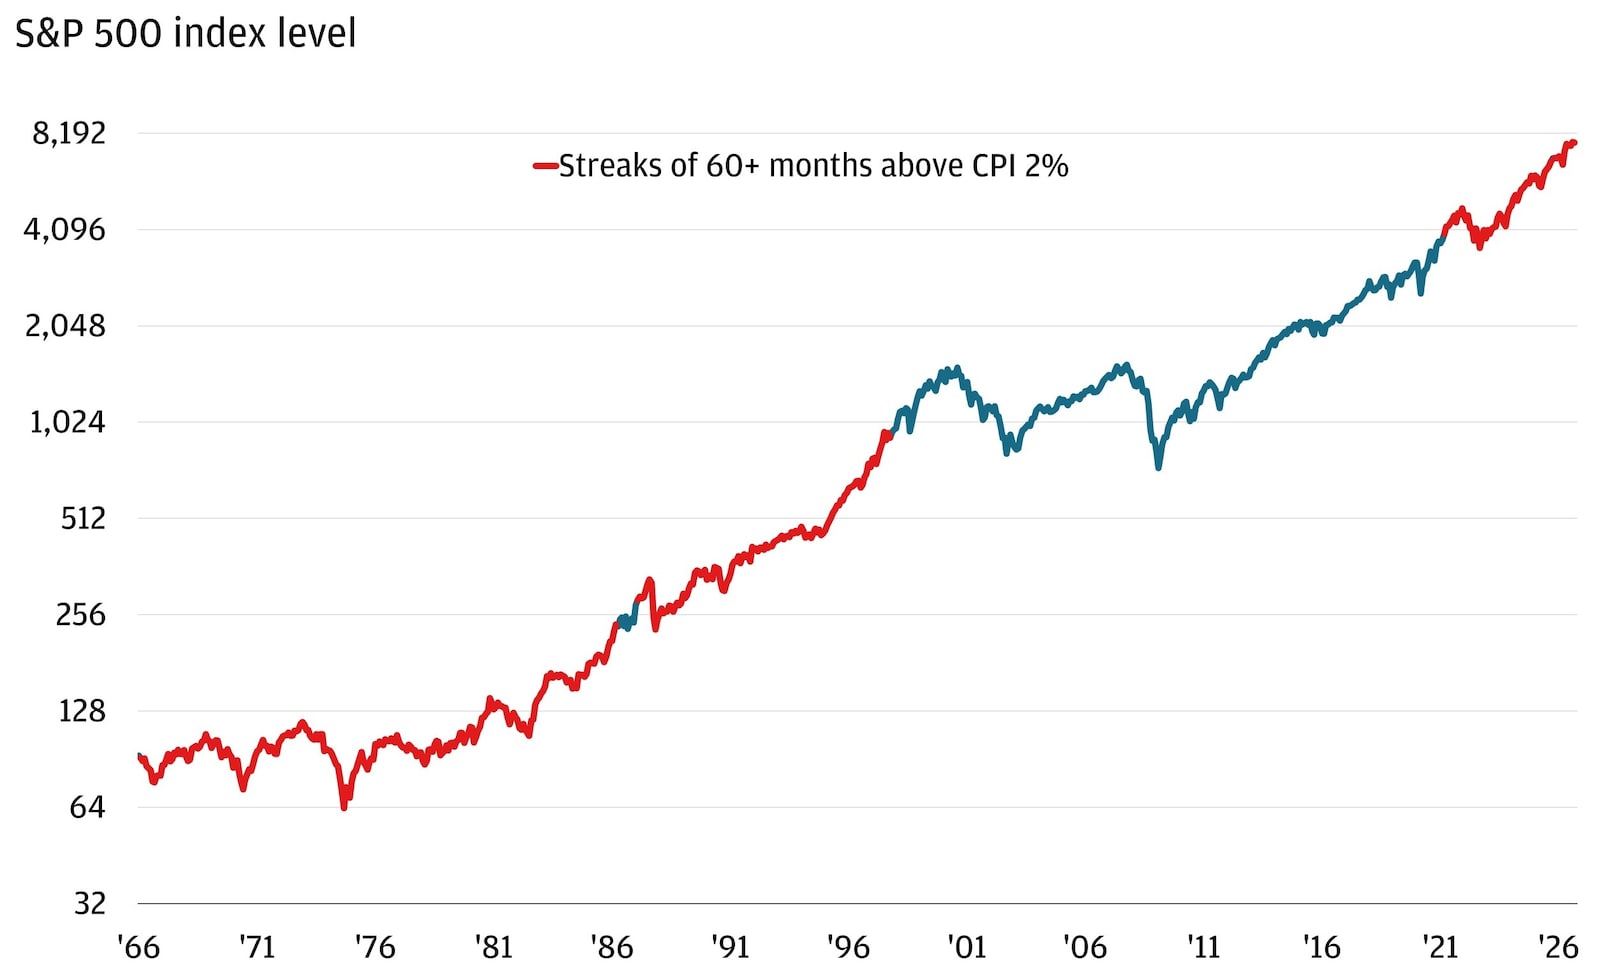
Inflation above 2% is not, by itself, a signal for stocks
Historically, stocks rise even during high inflation periods
Past performance is no guarantee of future results. It is not possible to invest directly in an index.
Across long stretches when CPI remained above 2%, the S&P 500 still compounded meaningfully. In fact, equities have historically delivered positive long-term returns even during extended periods of above-target inflation, including the current episode. It’s not that inflation is universally good for stocks, but a level of inflation above the Fed’s target says remarkably little about long-run equity returns on its own.
Inflation shocks can still create sharp near-term volatility; 2022 is a clear example. Inflation still matters over time to equity performance through changes in the policy path and discount rates, as well as pressure on real household income or corporate margins. The distinction is between a rate above 2% that is relatively targeted and an inflation process that is accelerating, broadening and becoming embedded in expectations. Equities have historically been able to live with the former. The latter is where the economic and valuation damage becomes harder to contain.
Treasury sell-offs usually produce a subdued – not uniform – stock response
Similar to inflation’s effect on equities, yield levels don’t matter as much to equities as the rate of change of yield levels. Mid- to long-end Treasury yields have hit levels not seen in about two decades, and yet equities hover near all-time highs.
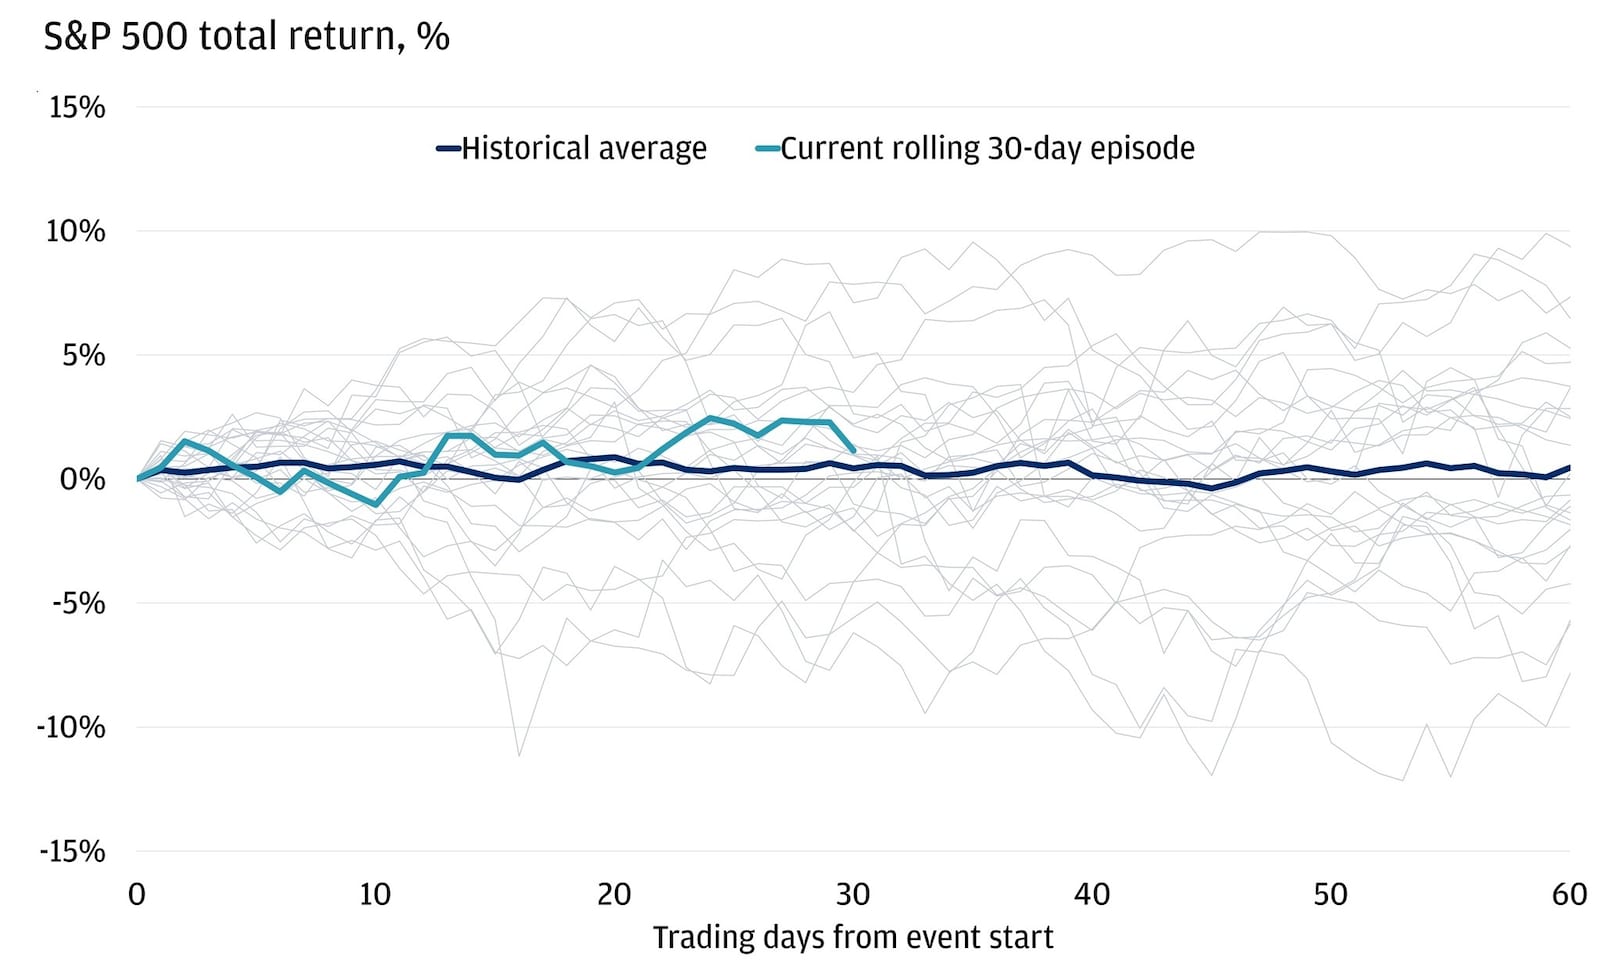
Treasury sell-offs don’t necessarily impact equity returns
Past performance is no guarantee of future results. It is not possible to invest directly in an index.
Treasury sell-offs have not produced one consistent outcome for stocks. On average, the S&P 500 response has been subdued: The historical path is soft and choppy, but only basically flat 60 trading days into the move. The individual episodes, however, are highly varied – some produced meaningful drawdowns, while others were absorbed with little lasting effect. That dispersion is the point: A bond sell-off can be a headwind, but the rates move alone does not determine the equity outcome.
Earnings are the fundamental driver
Inflation and yields matter most for stocks when they begin to weaken demand, compress margins, raise financing costs or force analysts to cut estimates. Until those effects show up in earnings, equities can often absorb a surprising amount of macro volatility. Credit is showing some early pressure – CCC-rated bond spreads are up more than 100 basis points this year – but it remains contained. Roughly 5.5% of the high-yield index is distressed, up from 4.4% but still well below the 11% seen in 2022. The equity sell-off over the past couple of days has also been driven by AI-linked debt concerns. Essentially, credit markets are repricing policy uncertainty, while the equity market is starting to search for evidence of fundamental damage.
Earnings season is therefore an important test. The first read from the large banks was broadly resilient: lending income and market-sensitive businesses provided support, while consumer credit did not show broad deterioration. The message is not that higher rates are harmless, but that the pressure remains manageable. Market concentration may also provide a near-term buffer because the largest index weights are profitable companies with significant cash generation: Only 48% of S&P 500 constituents are trading above their 200-day moving average, down from 73% just two months ago. That narrow leadership is not necessarily healthy over the long run (as we’re seeing over the past couple of days), but it can temporarily insulate the index from weakness among companies more immediately affected by higher rates and inflation.
As the rest of earnings season unfolds, the key question is whether inflation is beginning to weigh on company fundamentals. Consensus still calls for S&P 500 earnings to grow roughly 30% from a year earlier, which would mark a third consecutive quarter above 25%, while estimates actually rose during the quarter rather than following their usual downward drift. Furthermore, nine of 11 sectors are expecting double-digit earnings growth this year, including the Tech sector, which is expected to grow 64%. As long as earnings hold, equities can take hotter inflation and higher yields. If guidance starts to show weaker demand, margin pressure or rising financing costs, the same inflation data will matter much more.
What would turn pressure into upheaval?
Equities can continue to perform as long as investors continue to see tighter policy as a manageable adjustment rather than the start of a damaging cycle, and as long as earnings continue to show resilience.
The first warning would be a broader inflation process: consecutive upside core readings, stronger labor-intensive services inflation or rising market- and survey-based expectations. The second would be visible credit transmission: wider high-yield spreads, deteriorating interest coverage, rising delinquencies or tighter lending standards. The third would be a break in the earnings story through negative revisions, margin compression or weaker guidance.
Inflation and bond volatility are testing the equity market and will likely remain headwinds in the near term. Equities have absorbed the pressure so far, partly because of market concentration, and could continue to grind higher as long as these risks remain familiar and earnings bolster confidence.
All market and economic data as of 10/15/2026 are sourced from Bloomberg Finance L.P. and FactSet unless otherwise stated.
You're invited to subscribe to our newsletters
We'll send you the latest market news, investing insights and more when you subscribe to our newsletters.