The IPO wave is historic. So is today’s market.

’Tis the season of IPOs. After years of a stagnant initial public offering (IPO) market, a wave of private companies is preparing to enter public markets – and in size. With that resurgence comes a familiar question: Can markets absorb the supply? And there is a lot of supply to absorb.
The scale is undeniably historic. But it is underappreciated how immense the public equity market these firms are entering has become. While we may not have seen companies of this size before, we’ve also never seen a market this large, thanks to price appreciation over the past several decades. IPO supply is rising. But so has the market’s capacity to absorb it.
Liquidity zap (or not)
The theory is straightforward. Companies issue shares in the public market. The supply of shares in the overall market increases. If there isn’t enough demand to meet that supply, the market faces pressure.
After years of shrinking public equity supply, over $260 billion of equity issuance is expected to arrive this year. This marks a key reversal from the past few years. And in nominal terms, the numbers look large. But relative to the broader market, it really isn’t. Over time, the market cap of the S&P 500 has grown to over $65 trillion – about 55% higher than it was in 2021, the last time we saw IPO issuance of this volume.
IPO volume this year is estimated to be near 2021 levels
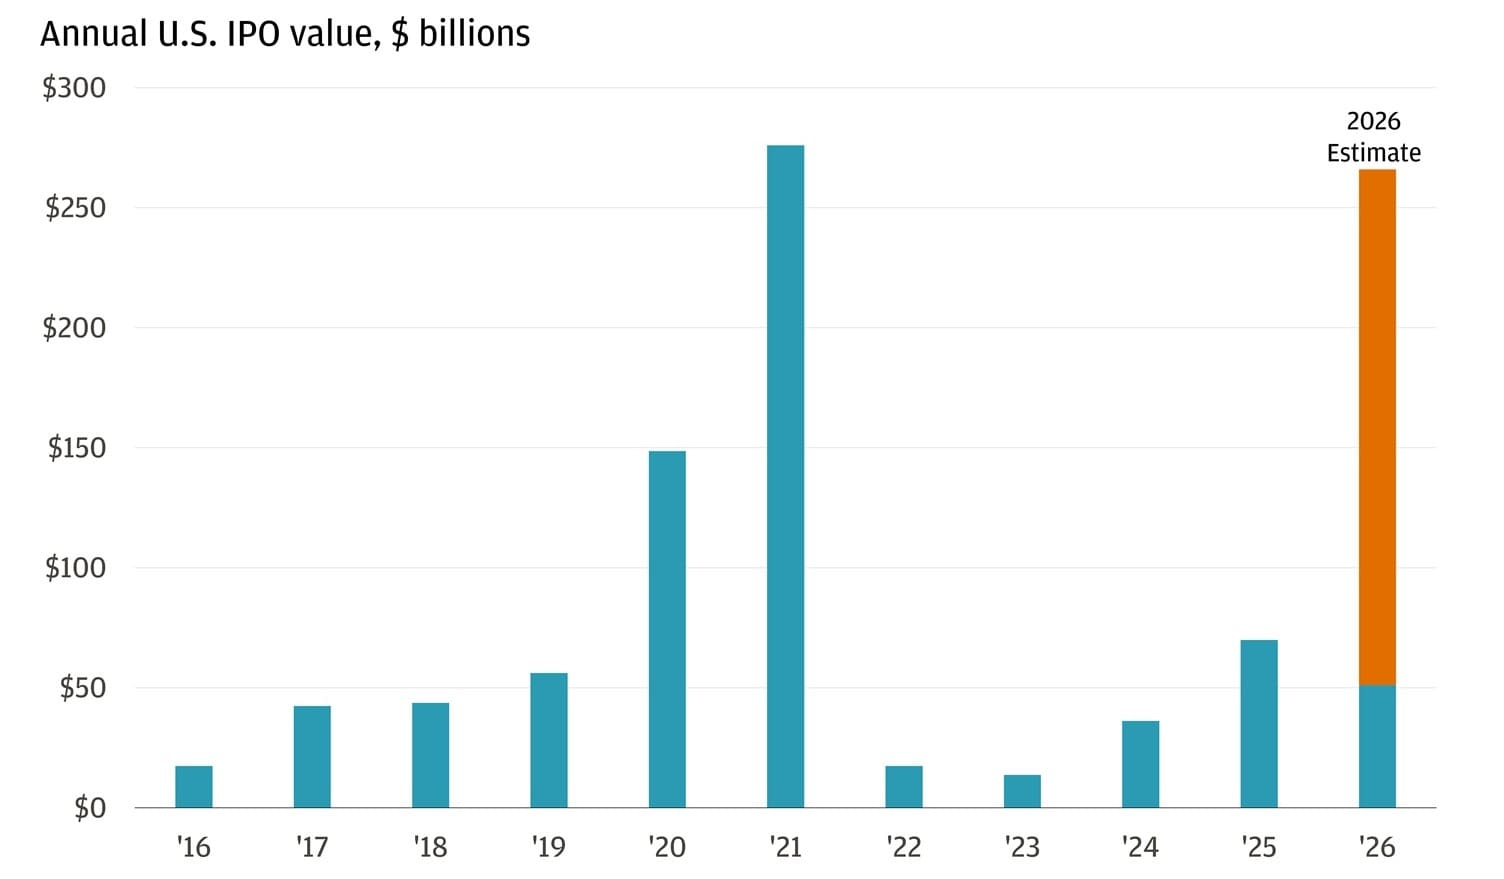
Issuance tied to IPOs and the shares insiders and early investors are allowed to sell after temporary restrictions post-public market debut together make up only about 1% of the overall market cap, according to some estimates. And the latter will likely arrive onto the market on a staggered basis over the course of the next 12 months.
To buy something new, an investor has to sell what they own. That means existing cohorts of the S&P 500 – and likely the largest weightings – could see temporary selling pressure. This could be driven by index rebalancing and individual investors looking to fund positions in new equity offerings.
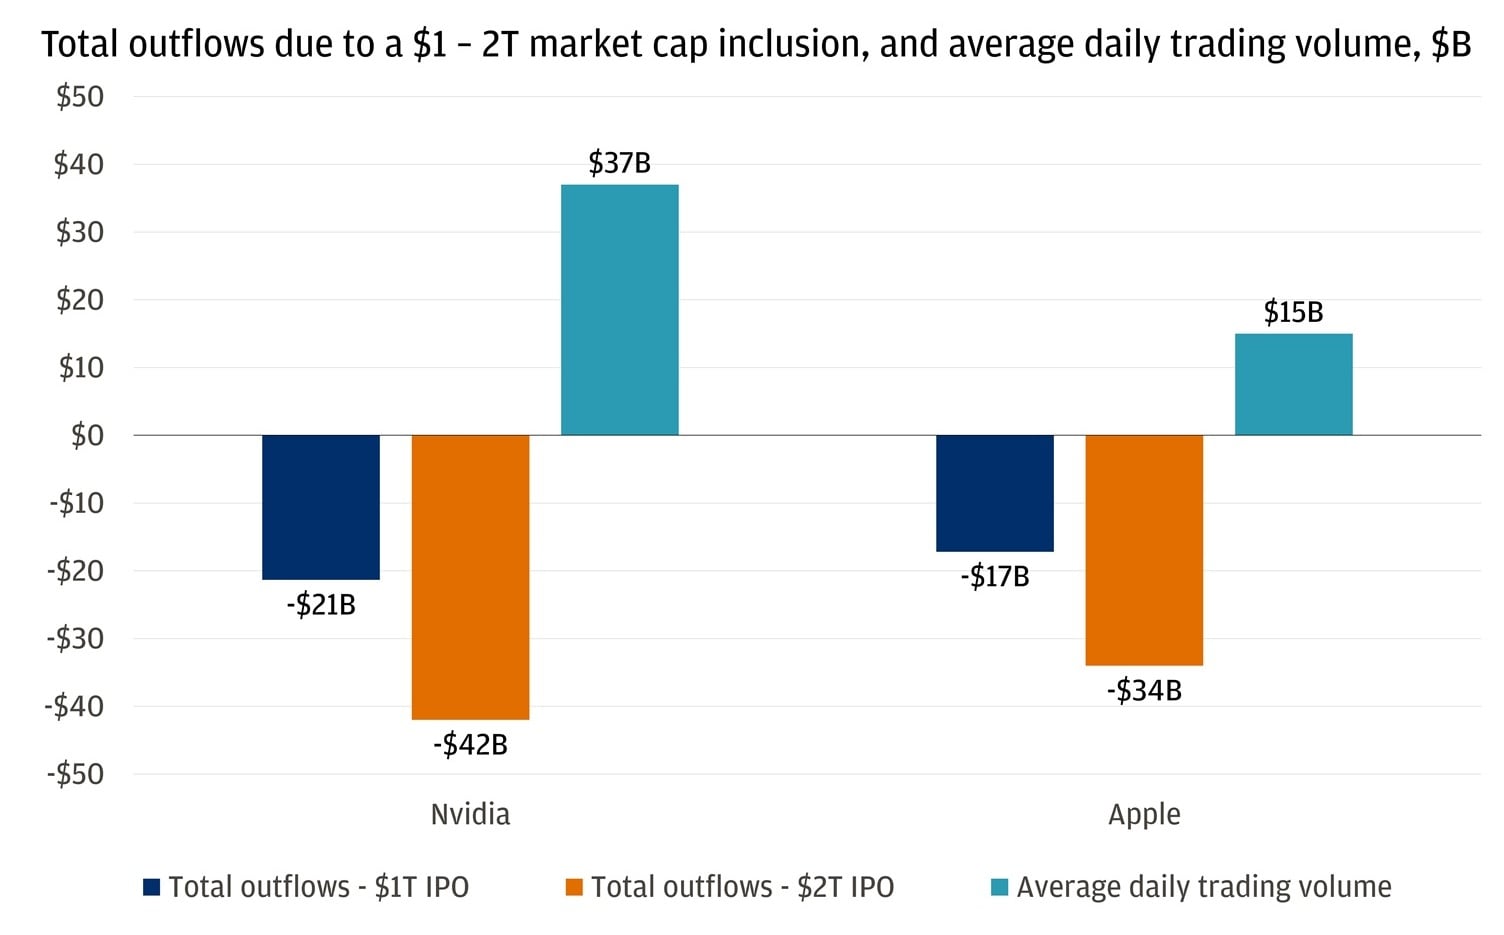
Consider two hypothetical scenarios for new IPOs valued at $1 trillion or $2 trillion with a 10% float (shares available for public trading in the market). Naturally, that leads to some selling by benchmark indices. But, looking at the two largest weights in the S&P 500, the total outflows would be equal to only about one to two days of their average daily trading volume. In other words: These are large deals, but they may not be too large for today’s market to digest.
Rebalancing volatility is meaningful, but manageable
Ready to take the next step in investing?
We offer $0 commission online trades, intuitive investing tools and a range of advisor services, so you can take control of your financial future.
Small spillover
Historically, going from IPO to being part of a benchmark index took time. Most index providers required shares to trade for a number of days or months – otherwise known as a “seasoning period” – before inclusion and mandated companies to clear specific eligibility screens before index-linked flows arrived. However, some have implemented a faster track to include IPOs of scale. These “fast-entry” mechanics can pull forward index inclusion and, as a result, passive, index-related flows.
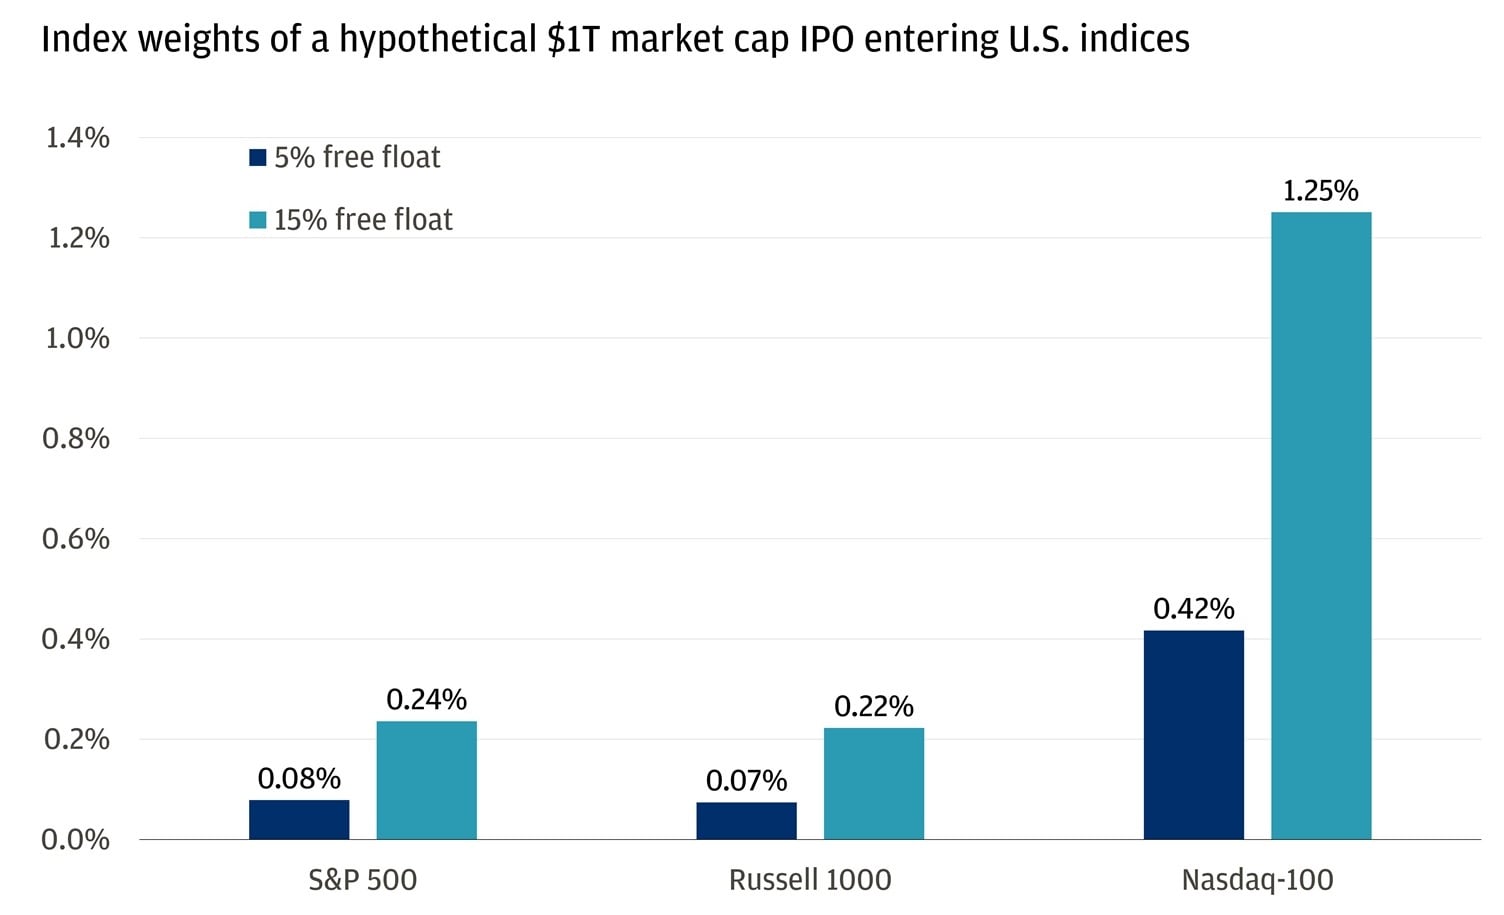
But even with the extraordinary headline valuations, mega-cap IPOs are expected to enter some U.S. indices at less than a 0.2% weight.
A low float means a low index weight
Pools of demand
Today’s equity markets have become more structurally sound, relative to history. Corporate demand in the form of buybacks remains robust, and the overall size of the stock market provides a deeper pool of capital to absorb new listings. And that’s if all else stays equal.
But what if demand is also increasing? Periods of market stress tied to issuance are rarely about the absolute level of supply. They’re about whether demand can keep up. And today’s demand drivers appear structurally stronger than in prior cycles.
Buybacks alone – although slowing on a year-over-year basis – are expected to reach $1.5 trillion this year. That’s more than the equity issuance expected in 2026 and on pace to reach levels that could fully offset new supply. Even in a scenario where IPO volumes rise more than expected and lockup expiries add incremental pressure, corporate demand alone may have the capacity to absorb a large share of equity supply coming to market.
It’s a dynamic that flips the traditional narrative. Rather than a market struggling to digest issuance, we are in an environment where demand – particularly from buybacks – may be doing much of the heavy lifting. Now add on mergers and acquisitions. The first half of 2026 has already seen a record start with nearly $900 billion in announcements.
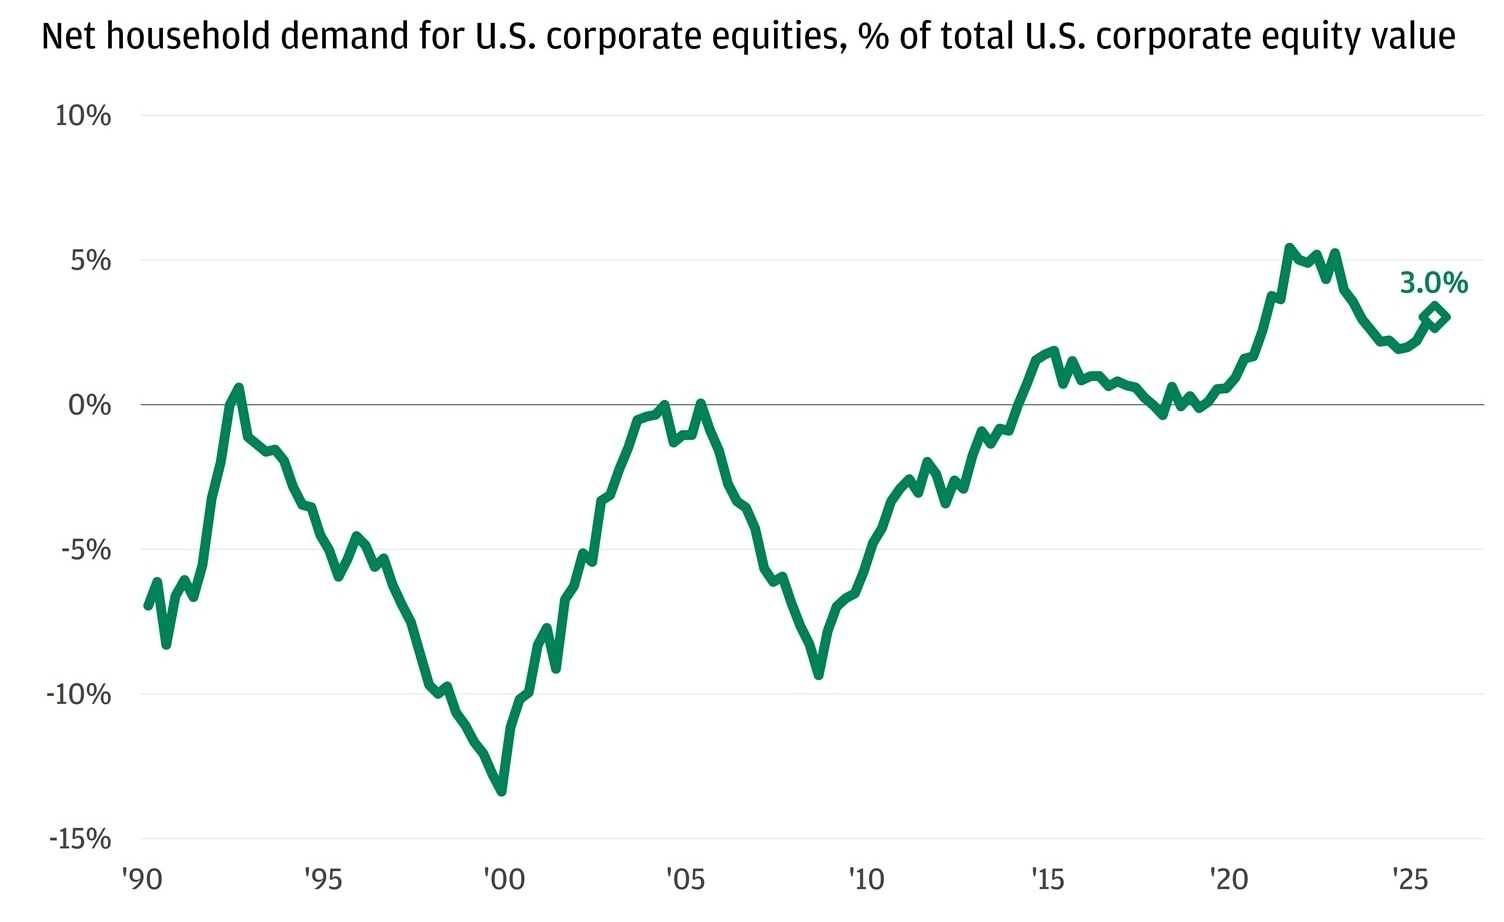
And don’t forget households and retail investors who – after being net sellers during prior cycles – have shifted to being net equities buyers in the past few years. Net household demand as a percentage of total corporate equity value sits at 3%.
Households are increasingly net buyers of U.S. equities
Is this the peak?
Large IPOs tend to align with broad-based enthusiasm, but history suggests they are not reliable signals of market peaks. Mega offerings can be as much a psychological event as a financial one. Periods of strong IPO activity are typically associated with rising optimism, risk appetite and confidence in growth opportunities.
The 25 largest IPOs in history have often accompanied market uptrends. While what’s happened in the past doesn’t guarantee what will happen next, two-thirds of them were followed by positive returns in the S&P 500 in the year that followed their issuance date, with gains anywhere between 5% and 20% on a forward 12-month basis.
Even a historic surge in IPO supply is unlikely to overwhelm markets that are larger, deeper and supported by multiple sources of demand.
All market and economic data as of 06/12/2026 are sourced from Bloomberg Finance L.P. and FactSet unless otherwise stated.
You're invited to subscribe to our newsletters
We'll send you the latest market news, investing insights and more when you subscribe to our newsletters.

Executive Director, Global Investment Strategist, J.P. Morgan Private Bank

U.S. Equity Strategist, J.P. Morgan Global Wealth Management