Not a red flag: The market-economy disconnect

Executive Director, Global Investment Strategist, J.P. Morgan Private Bank

The U.S. stock market has rallied nearly 10% in the first six months of 2026 – more than double the average returns traditionally seen in the first half of the year, according to data going back to the turn of the century. But for an economy that is largely driven by the American consumer, are the stock market gains reflecting the underlying reality? And perhaps more importantly, should they be?
Historically, the stock market and consumer confidence moved in tandem. As the business cycle progressed, so did the optimism, and hence higher stock valuations. In a recession, both sentiment and market pricing reset. But since the post-pandemic recovery, that relationship is no longer as close. Inflationary pressures and affordability challenges have caused consumer sentiment to sour even as fiscal policy, tax cuts and receipts, and household deleveraging have cushioned the impact. Meanwhile, the stock market has continued to rally. The disconnect, however, is not cause for concern. Instead, it is laying the foundation for future productivity growth and economic broadening.
The stock market and real economy are no longer in sync
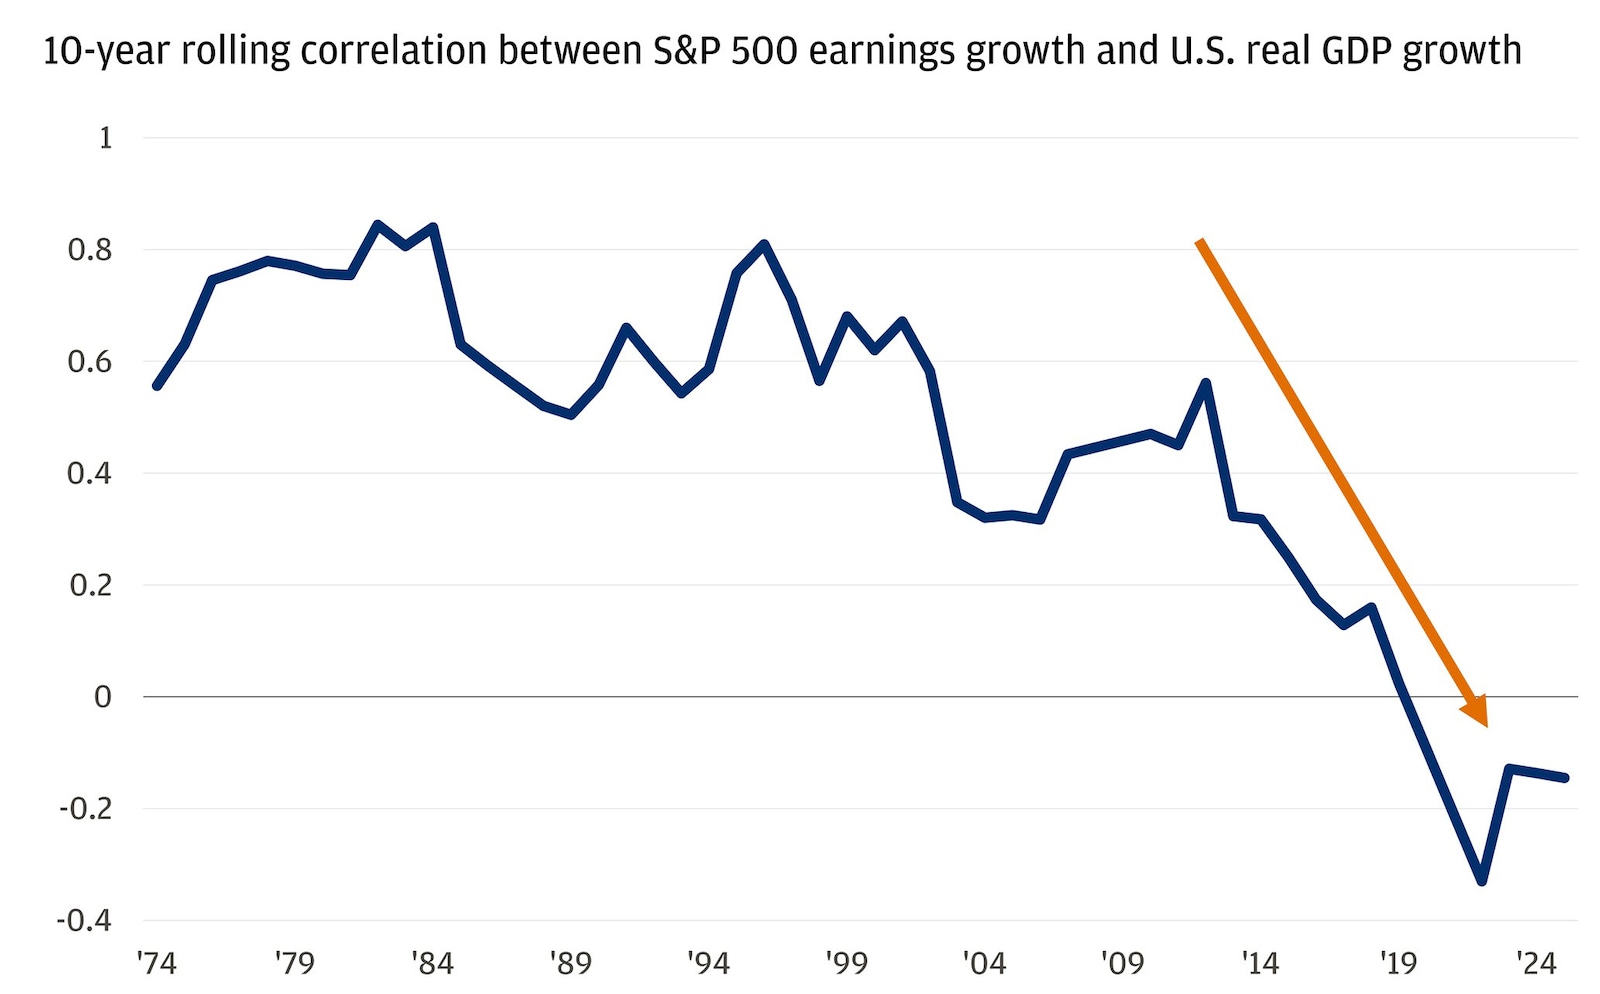
Not in sync, and that’s OK
There are times when the economy and financial markets are in sync, and there are times when the forward-looking element of market pricing starts to drift from real-time activity.
Based on market cap, 37% of the S&P 500 is technology-driven. Another 14% is made up of the consumer discretionary and consumer staples sectors. Naturally, spending fuels all types of companies, but the companies with the most direct exposure to consumer spending not only make up a smaller percentage but are growing at a slower rate than the broader benchmark as a result of pricing power, local manufacturing capacity and global factors.
In some ways, this reflects an economic stabilization after a period of post-pandemic volatility. The U.S. economy at one point in 2023 was growing at almost 3.5% real gross domestic product (GDP) and has since been gradually normalizing. The economy grew at 2.1% in the first quarter of this year – still in line with the average trend of a 2% GDP growth rate during an expansionary phase.
In the stock market, this type of growth is often met with a wider array of sector gains. And there are early signs that’s already happening. If artificial intelligence (AI) is driving technology-related returns in the interim, as other sectors adopt and see similar margin expansion, the entire stock market will likely benefit. Take the financial sector as an example, which, after technology, is seeing margin improvement as those companies become growing users of AI.
Ready to take the next step in investing?
We offer $0 commission online trades, intuitive investing tools and a range of advisor services, so you can take control of your financial future.
It’s more than just tech
Roughly 50% of the S&P 500 is exposed to AI in some capacity, but it’s more than just the technology sector that is benefiting. From the industrial components that go into building data centers to the utilities supporting them with power, a tech-driven buildout can cascade across sectors. Capital expenditure across the S&P 500, driven by hyperscalers, is set to grow around 80% this year after a similarly large boom last year.
Infrastructure investment continues to climb
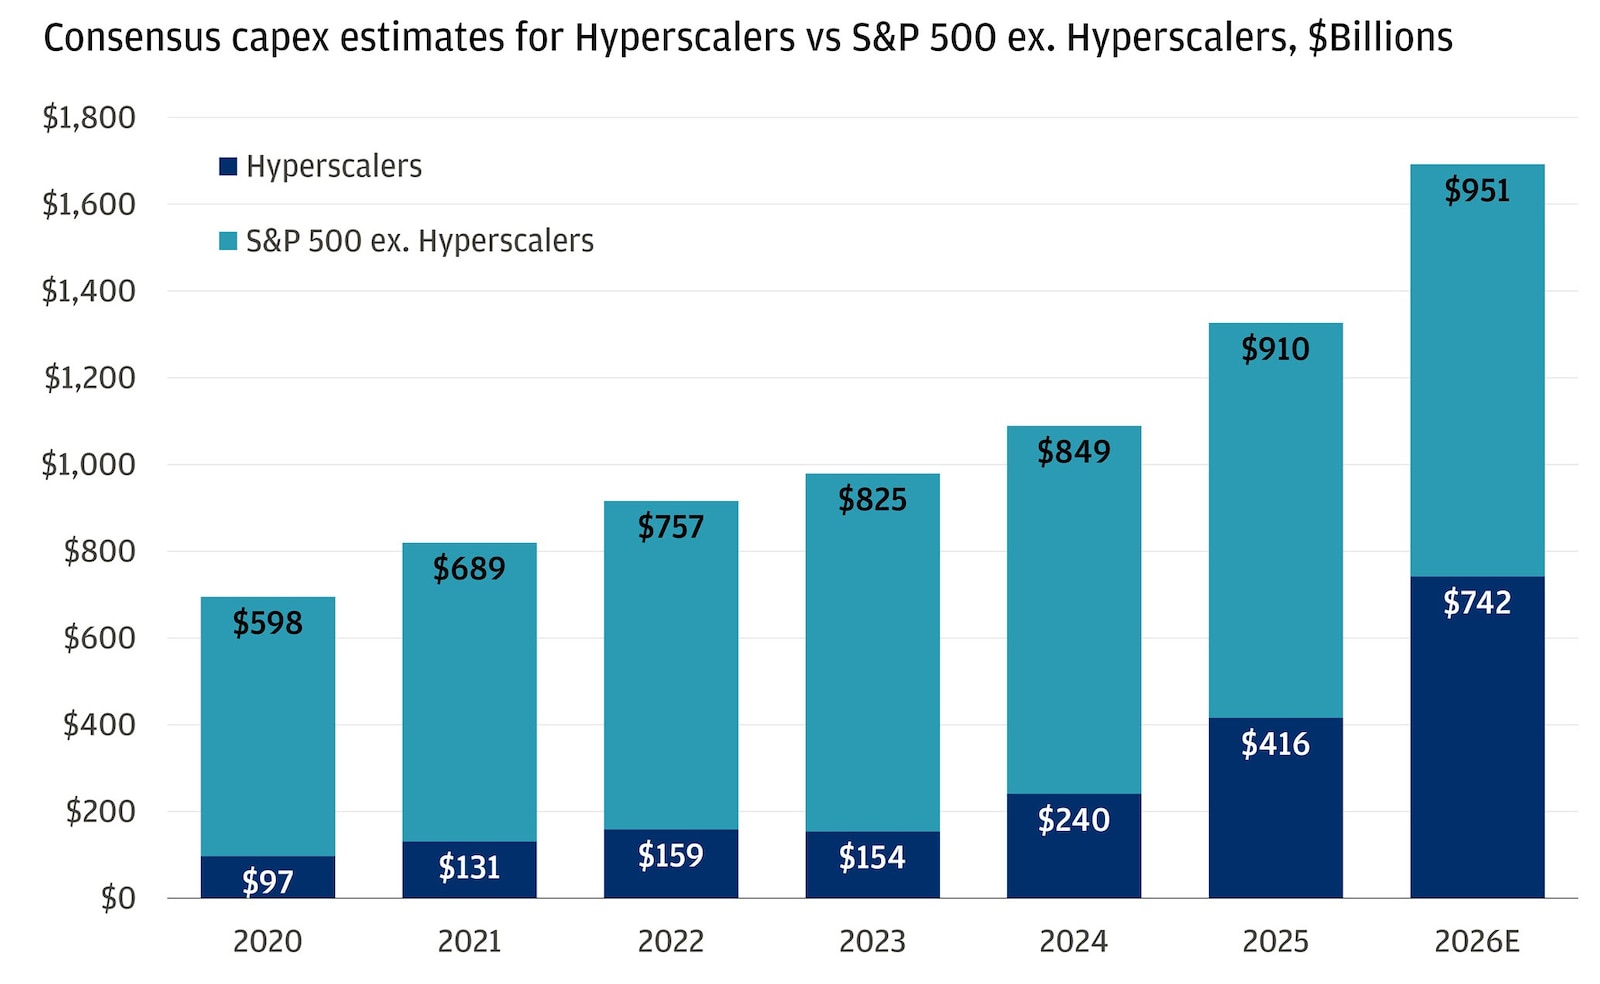
In the first quarter, revenues grew almost 11% across the index, but earnings grew 28%. Margin expansion – which has expanded nearly 5% over the last couple of years – is a key piece of what’s driving that differential as companies heavily using AI see lower costs as a result.
But whereas early signs of broadening are evident in the stock market, in the real economy, there is a historic divergence between tech-related investment across the United States and non-tech-related investment.
Tech spending is outpacing non-tech capital expenditures
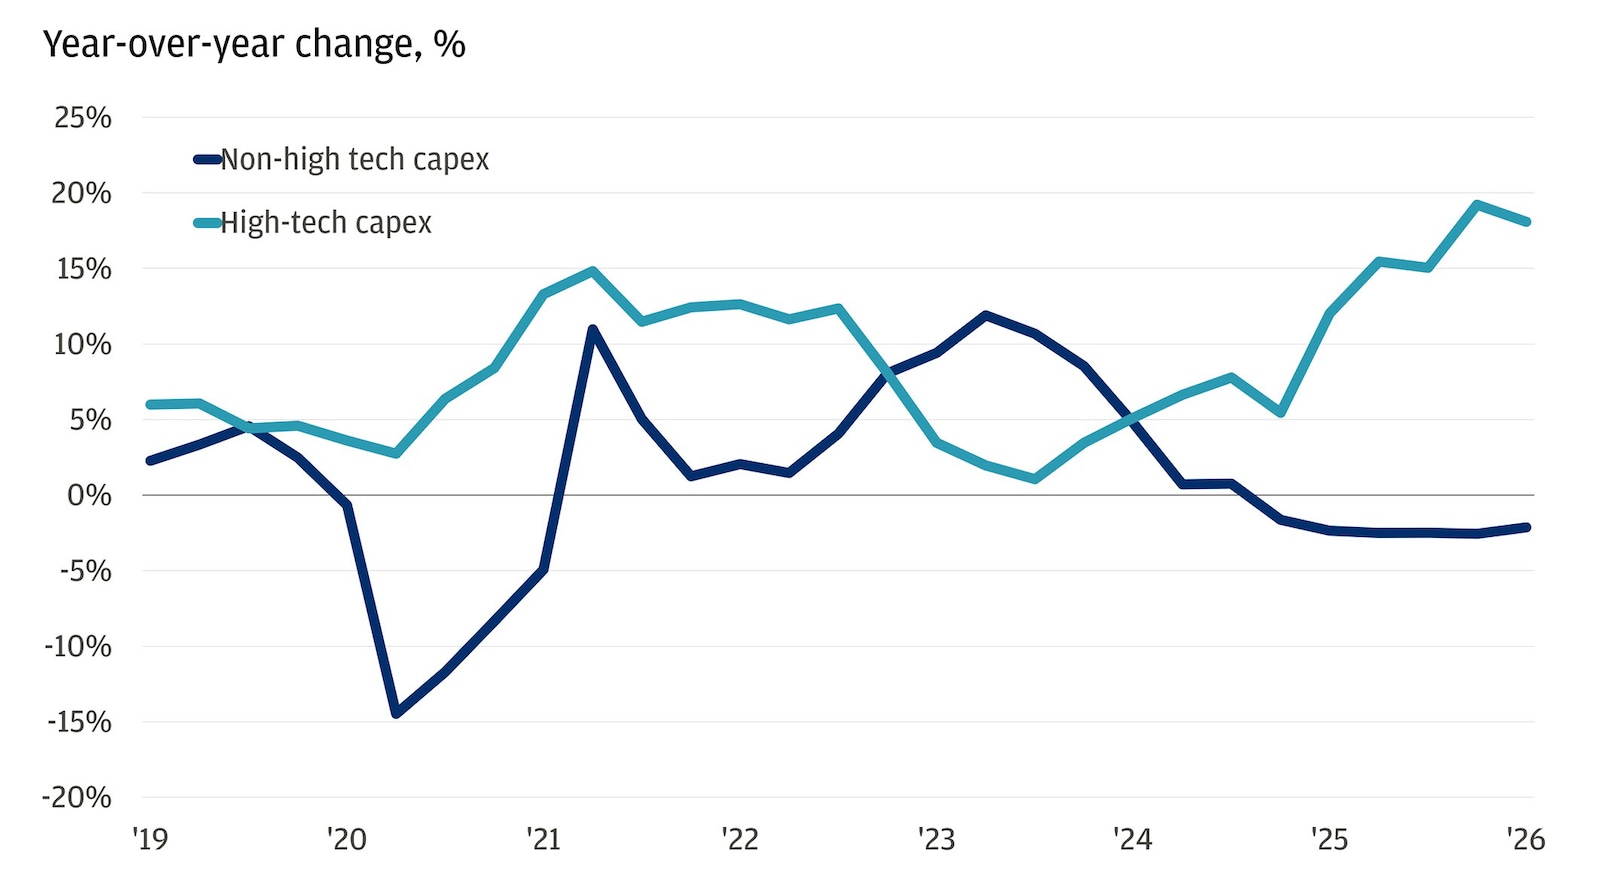
That’s the disconnect that can worry investors, as financial markets price in a future that hasn’t yet been realized. Meanwhile, in a stock market that has already priced the revolutionary potential of AI use, capital has moved to the broadening theme – healthcare, financials, industrials and non-AI tech such as software.
It’s a new era where both the stock market and sentiment can diverge without necessarily signaling trouble, as forward-looking equity prices increasingly reflect a fast-paced, AI-driven reality while the real economy adapts more gradually.
All market and economic data as of 07/10/2026 are sourced from Bloomberg Finance L.P. and FactSet unless otherwise stated.
You're invited to subscribe to our newsletters
We'll send you the latest market news, investing insights and more when you subscribe to our newsletters.