Lessons from “Liberation Day”: A guide to tariffs

J.P. Morgan Wealth Management

Market update
Tariffed. Global markets went into risk-off mode following President Donald Trump’s Wednesday evening tariff announcements, with losses outsized in the U.S.
The S&P 500 sold off -4.8%, erasing $2.4 trillion of market cap and marking the worst one-day performance since 2022. Sectors with stretched valuations sold off the most, with the tech sector lower by -6.7%, the Magnificent 7 off by -6.7% and the tech-heavy Nasdaq 100 down -5.4%.
International equities didn’t fare much better. In Europe, stocks fell -3.6%, while Chinese (Hang Seng -1.5%) and Japanese (TOPIX -3.1%) equities also declined.
On top of all the equity moves, investors had to digest a decline in U.S. services activity, which points to declining business sentiment even before the tariff announcement.
Investors bought fixed income to hedge growth slowdown risks, and yields across the Treasury curve rallied. The 2-year (3.68%) and 10-year (4.03%) were lower by 18 basis points and 10 basis points, respectively. Futures markets increased their expectations of interest rate cuts this year by a full 25 basis points.
The dollar weakened on growth concerns. The greenback declined -1.8% versus the euro, -1% relative to the Canadian dollar and -1.3% against the Mexican peso.
In commodities, oil ( -6.4%) sold off below $70 per barrel as OPEC+ unexpectedly tripled its planned May oil supply increase. The move, likely influenced by U.S. pressure to lower prices and offset Iranian sanctions, marks a shift in OPEC+’s strategy. Gold ( -0.6%) declined from its all-time high levels amid broad market selling.
This morning, China announced that it will impose a retaliatory 34% tariff on all U.S. imports starting April 10. As of 6:30 am EDT, U.S. equities are extending their losses with S&P 500 futures down -2.3%.
Below, we recap the tariff announcements this week and give our take on what to do next.
Spotlight
Rumble in the Rose Garden
What was announced? President Trump is imposing a minimum 10% tariff on all exporters to the U.S. and additional reciprocal duties on approximately 60 nations with the largest trade imbalances with the U.S. The tariffs will be implemented from April 5 to 9.
What are reciprocal tariffs? Reciprocal tariffs are trade duties imposed by a country in response to tariffs levied by another country, aiming to equalize the trade conditions between them. In the context of President Trump’s administration, reciprocal tariffs were part of a strategy to address perceived trade imbalances and protect domestic industries by imposing similar tariffs on imports from countries that had imposed tariffs on U.S. exports. This approach is intended to encourage negotiations and potentially lead to more favorable trade terms for the imposing country, though it can also lead to trade tensions and economic disruptions due to retaliation or changes in consumption (discussed further below).
Work with an advisor
Our advisors can provide ongoing financial advice on how your portfolio can adapt to the changes in the market, your life and your goals.
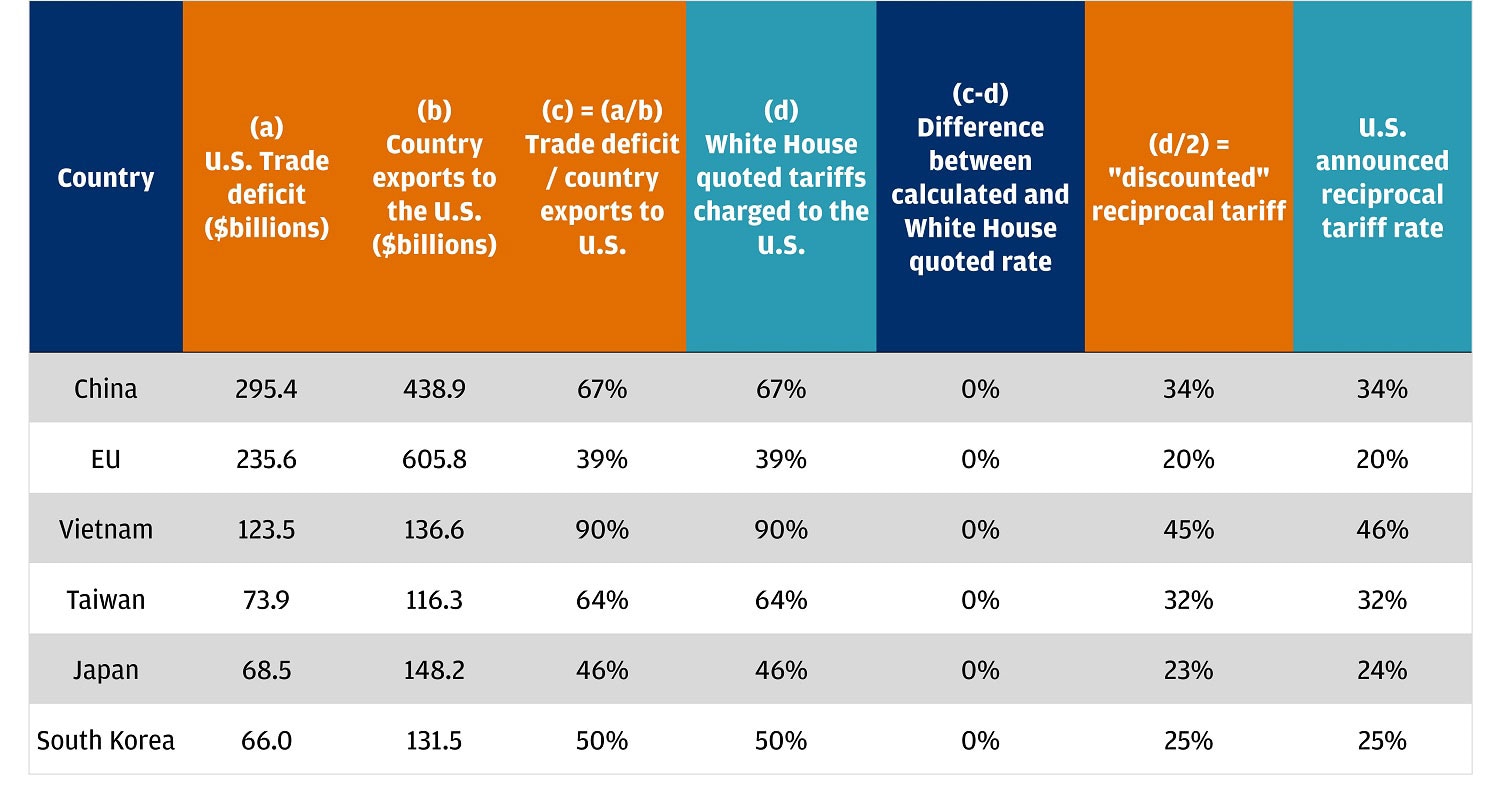
As our Chairman of Asset and Wealth Management Investment Strategy, Michael Cembalest, noted in his latest piece, Redacted, the tariff rates announced appear to be calculated as the greater of 10% or the country’s trade surplus (exports to the U.S. minus imports from the U.S.) divided by its exports to the U.S. The table below indicates how that calculation shakes out for the six largest trade deficit countries targeted by reciprocal tariffs.
What wasn’t included in the announcement?
- Notably, the United States’ two largest trading partners, Canada and Mexico, were left off the list and their existing 25% tariffs (with important carve-outs) will remain in place.
- According to the executive order, some goods will be carved out (though they could face levies outside the scope of reciprocal tariffs), including:
- Steel/aluminum
- Copper
- Pharmaceuticals
- Semiconductors
- Lumber articles
- Bullion
- Energy materials that are not available in the U.S.
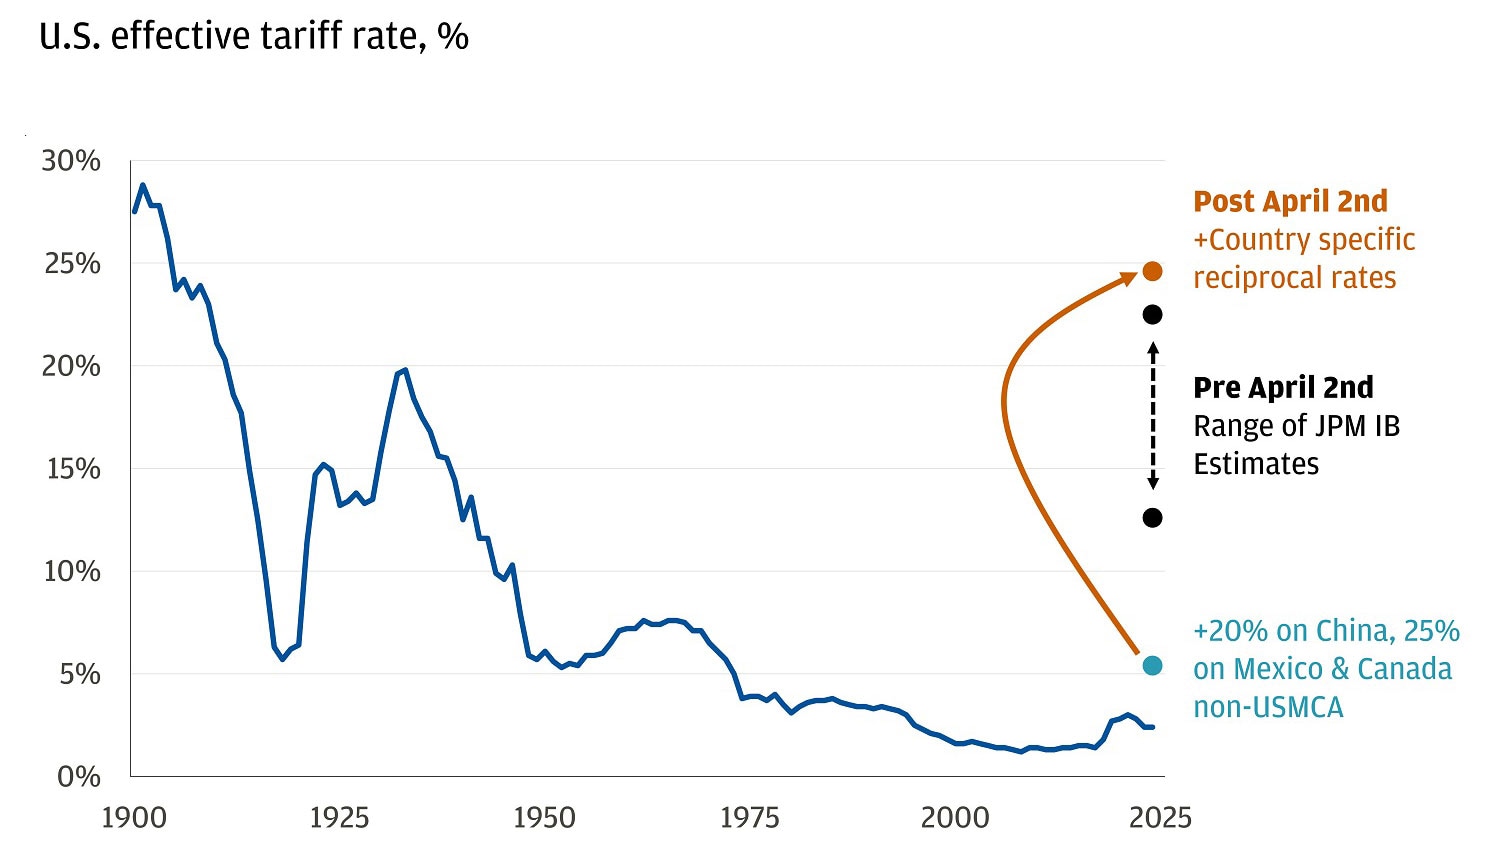
What’s the effect? This raises the average effective tariff rate in the United States to around 25% from around 5%. The new levies push the effective tariff rate to the highest level in over 100 years.
April 2nd tariffs exceeded expectations
This is higher than market participants were expecting. According to a Goldman Sachs survey, only 65% of investors actually expected reciprocal tariffs to be levied and if they were levied, only 10% to 15% of them thought they would raise the tariff rate by 15 percentage points or more. A big question is whether these are negotiating positions and if the rates will decline after negotiations, or if the new rates are durable.
What does it mean? We estimate yesterday’s announcement could impact U.S. GDP by 1.5% to 2%, potentially reaching 2.5% when considering all tariffs this year. This could alter the economic outlook and increase recession risks beyond the 25% previously estimated. Uncertainties remain regarding legal challenges, negotiations and subsector exclusions, ensuring continued trade policy uncertainty.
What do we think? The announced tariffs land at the higher end of our expectations prior to the press conference. All else being equal, we anticipate the effect of the tariffs to present a meaningful headwind to U.S. growth and increase inflation.
What to do? This makes us marginally less positive on U.S. risk assets and marginally more positive on diversification, namely through structures, fixed income and gold. Ensure portfolios are diversified and resilient to withstand market cycles and align with your long-term goals. Our order of operations for investors considering their next move would be as follows:
1. Structured Notes: Leverage market volatility with structured notes that are designed to offer downside protection and potential for enhanced yield. These instruments can provide strategic opportunities to capture upside while offering buffers against market drawdowns.
2. Gold: Consider gold as a potential diversifier, as it may offer resilience amid volatility and geopolitical tensions. With recent market retreats, it might be worth evaluating whether to build a position, given its exemption from tariff measures and potential for price appreciation.
3. Bonds: Consider using bonds as a hedge against growth challenges by moving out of cash and into core bonds, which are designed to offer resilience against growth shocks. Diversified, laddered bond portfolios may help increase yield and duration without sacrificing quality, potentially providing a reliable foundation in uncertain times.
Above all, remember that market volatility is a normal feature of markets. We’ve had growth shocks before and through it all, sticking to your strategic asset allocation with equities for capital appreciation, fixed income for downside growth resilience and opportunistic themes at the tactical margins has proven itself over time.
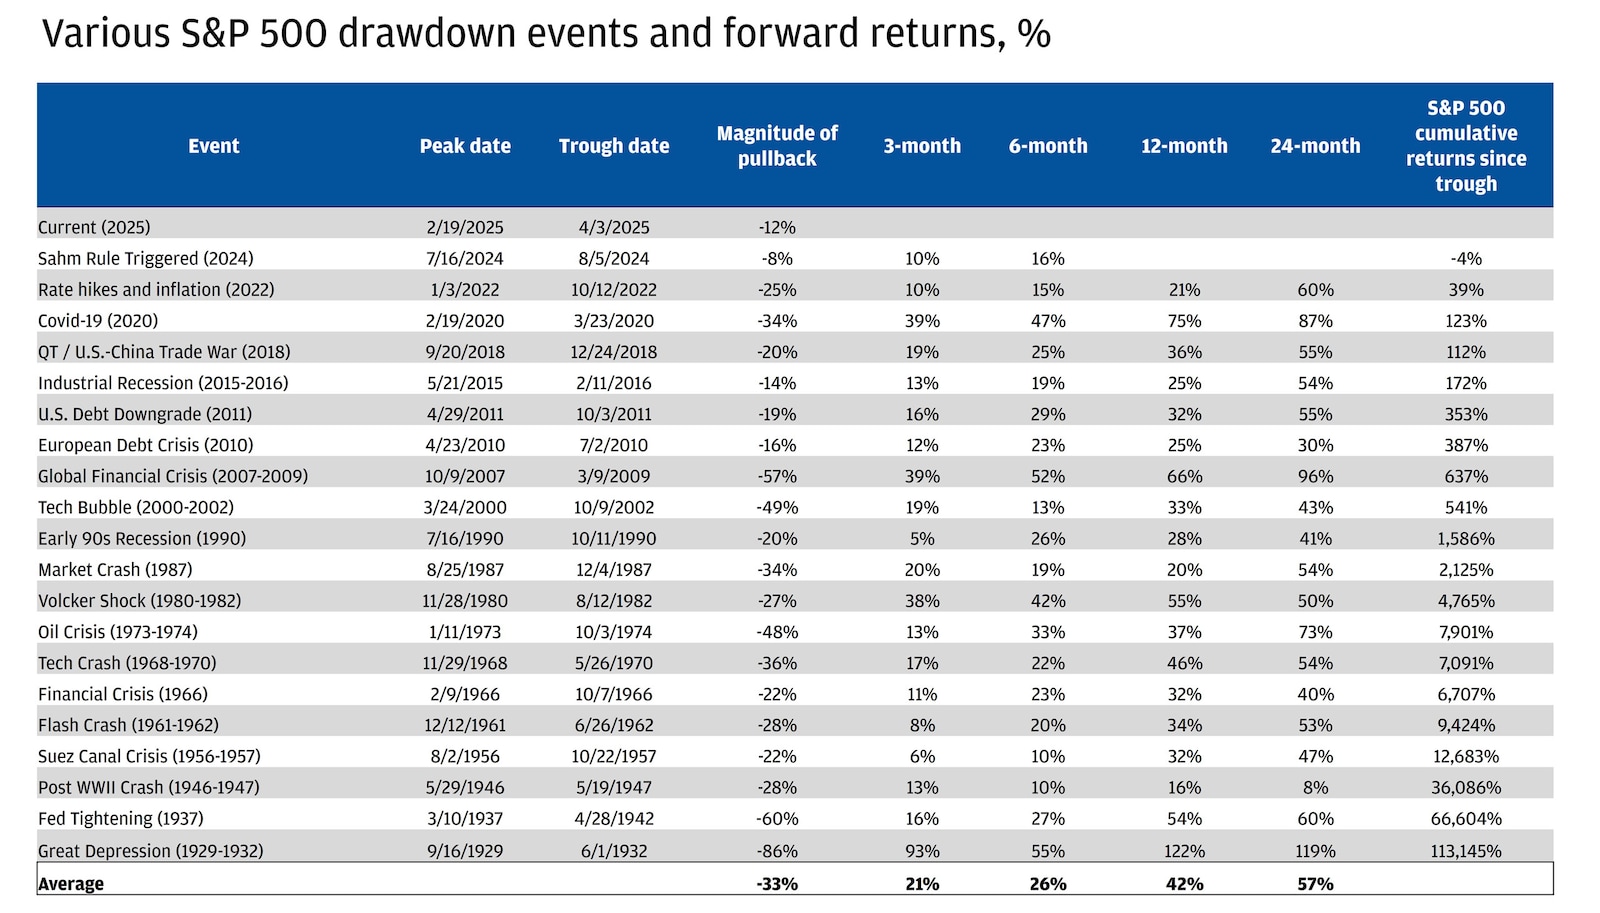
Drawdowns happen, and historically so have recoveries
As always, your J.P. Morgan advisor is here to help.
All market and economic data as of 04/04/25 are sourced from Bloomberg Finance L.P. and FactSet unless otherwise stated.
Explore ways to invest
Take control of your finances with $0 commission online trades, intuitive investing tools and a range of advisor services.
J.P. Morgan Wealth Management