30 years of foresight: The 2026 J.P. Morgan Long-Term Capital Market Assumptions in focus


How did markets react to this week’s news?
U.S. equities climbed this week on strong earnings and artificial intelligence (AI) optimism – even as markets weathered renewed U.S.-China tensions and fresh Russia sanctions – while bonds ended flat to down as investors awaited today’s key inflation data and next week’s expected Federal Reserve (Fed) rate cut. That said, let’s shift focus to how this year’s J.P. Morgan Long-Term Capital Market Assumptions (LTCMAs) help translate these near-term swings into long-term portfolio outcomes.
Setting the stage for the 2026 LTCMAs
The LTCMAs are out, setting the stage for how we think about risk, return and portfolio construction for the next 10 to 15 years – not short-term market moves or headlines.
What are the LTCMAs?
Now in their 30th edition, the LTCMAs are more than just a forecast – they’re the engine behind our planning analytics and the backbone of our investment process. Built from the ground up using a transparent, data-driven “building block” approach, we break down expected returns for each asset class into core components like (GDP) growth, inflation, yields and valuations. These inputs are stress-tested across over 200 asset classes and 20 currencies, ensuring every projection is grounded in economic reality. The result? A robust, forward-looking framework that underpins over $1 trillion in long-term investment portfolios.
Why do they matter?
The LTCMAs turn insights into action. They drive expected returns and risk for every portfolio scenario, from stress-testing market downturns to mapping out a 20-year retirement plan. Investors can “pre-experience” a range of market conditions, seeing how their goals hold up in everything from bull runs to bear markets. They also help define risk buckets – liquidity, lifestyle, growth and legacy – each with its own risk profile and time horizon. They calibrate the right risk level for each bucket, ensuring projected volatility and returns match the investor’s goals. This lets investors walk through best- and worst-case scenarios, visualizing how different allocations would have performed in past crises. It’s not just about averages – it’s about building confidence by understanding trade-offs and making informed decisions.
Why are they relevant through both a short-term and long-term lens?
This year’s LTCMAs arrive at a pivotal moment, as investors grapple with a world that feels both resilient and uncertain. The headline numbers might seem like modest changes, but the underlying themes are anything but static. The shift beneath the surface is defined by a trio of forces: Economic nationalism is putting up new barriers, dragging on growth and stoking inflation; fiscal activism is back in the spotlight, with governments ramping up spending, fueling demand but also adding to price pressures; and the acceleration of technology – especially AI – is transforming business models, driving capital spending and supercharging productivity, even as it sparks volatility.
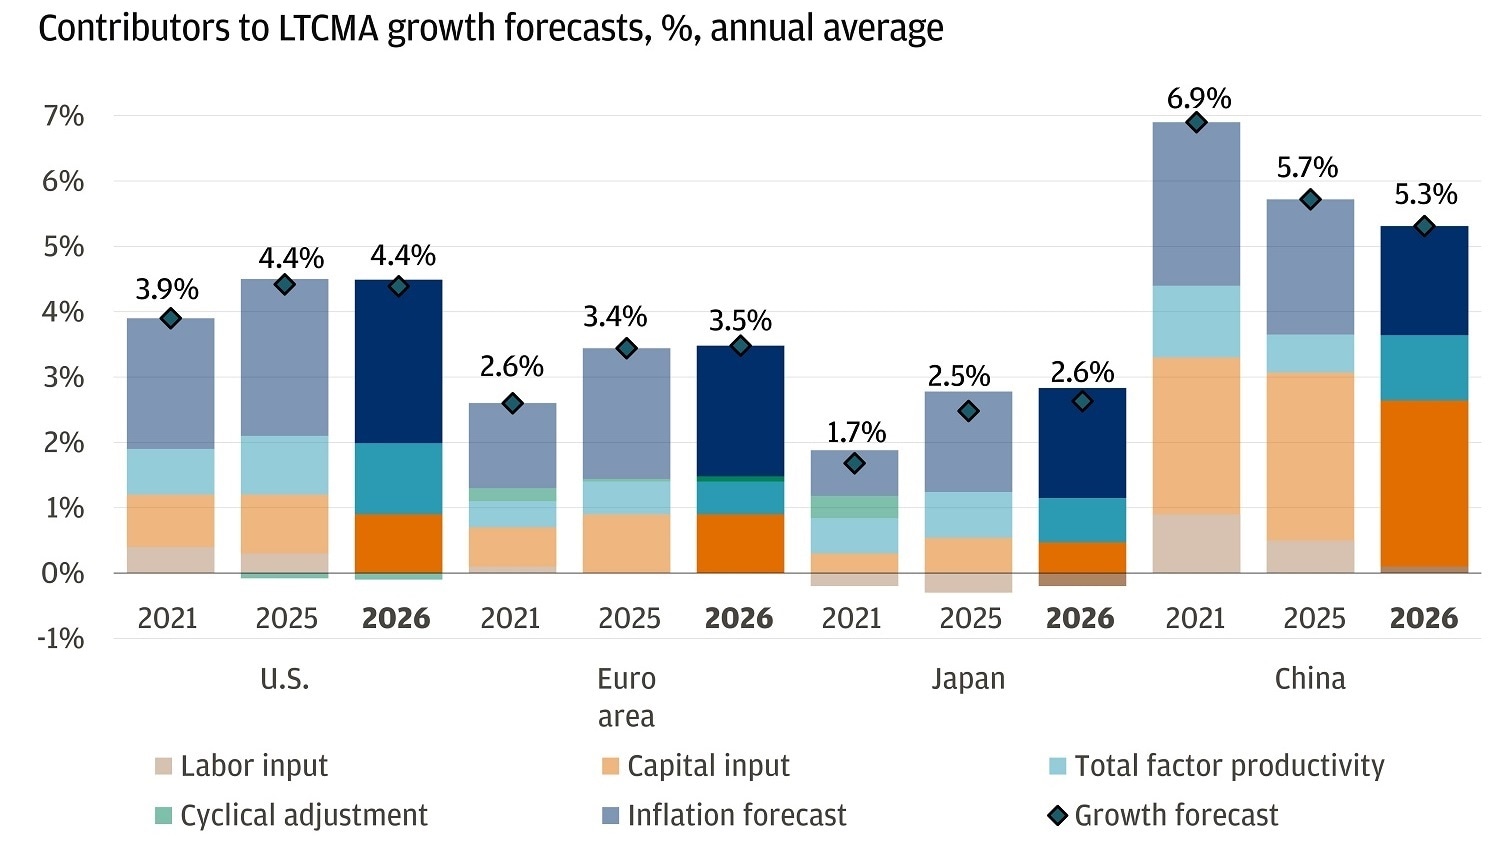
2021 vs. 2025 vs. 2026 LTCMA nominal GDP growth forecasts
With that being said, here’s how the LTCMAs help investors address today’s most pressing questions – and turn today’s concerns into opportunities:
Ready to take the next step in investing?
We offer $0 commission online trades, intuitive investing tools and a range of advisor services, so you can take control of your financial future.
Breaking down the insights from the 2026 LTCMAs
Understanding the “growth gap” between GDP and revenue trends
One of the most common questions we hear is, if U.S. GDP growth is projected to slow to 1.8%, how can equity return forecasts remain steady? The answer: revenue growth, which tracks nominal – not real – GDP, is expected to outpace the growth of the economy.
This clarification is important because investors often focus on real GDP, which is adjusted for inflation, making the gap between 1.8% real GDP growth and 6% revenue growth seem wide. While there’s still a gap between nominal GDP growth of 4.3% and revenue growth, nominal GDP provides a more accurate benchmark for revenue trends.
There are two main reasons for this:
- U.S. companies benefit from a sector mix tilted toward higher-growth, higher-margin industries like technology.
- Nearly 30% of S&P 500 revenues come from outside the U.S., tapping into faster-growing foreign demand.
Looking back at history, revenue growth has outpaced nominal GDP over 60% of the time, especially during periods of strong corporate pricing power and innovation. The result: U.S. large caps are projected to return 6.7% annually, even as valuations are expected to be a drag.
Navigating a high bar for valuations
After several years of strong performance, valuations are elevated – and expected to be a headwind for returns.
Contributions to equity return forecasts for key indices
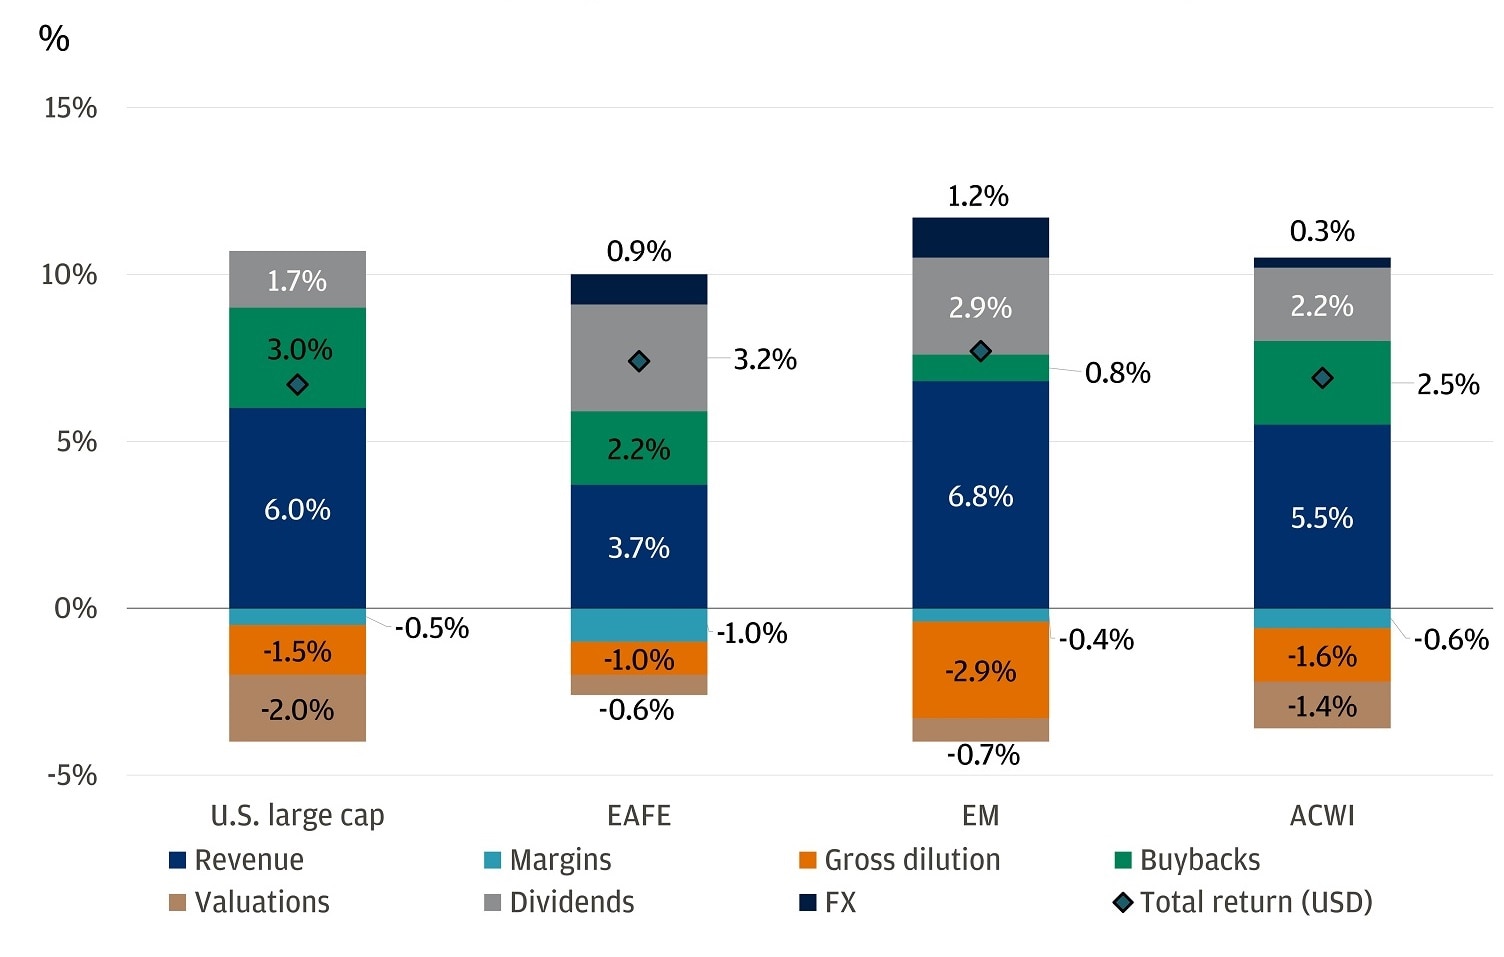
The LTCMAs model this by projecting a gradual decline in price-to-earnings ratios from current levels, which will weigh on total returns. Still, there are compelling reasons why valuations can remain higher than historical averages. In the U.S., the index composition has shifted toward higher-quality, faster-growing companies – particularly in technology and other sectors with resilient margins and strong global reach. Buybacks are projected to contribute 3% to total returns, while gross dilution is expected to be a 1.5% drag. Dividend yields are forecast to stay flat in the near term, then trend up, providing an annualized 1.7% contribution to returns. This means that while the easy gains from multiple expansion may be behind us, the evolving makeup of equity markets and the premium placed on growth and profitability suggest that elevated valuations can persist.
Rethinking diversification
The LTCMAs project that the correlation between stocks and bonds may continue to drift higher and turn positive, reflecting a world of elevated inflation and rate volatility. This doesn’t mean bonds have lost their value as diversifiers – especially when growth scares spook markets. High-quality fixed income still maintains the lowest correlation to equities among liquid assets and the return to a higher yield environment has restored its capacity to potentially deliver significant positive returns if rates decline. But in a world where stocks and bonds could move in tandem, investors might consider diversifying the diversifiers by adding assets that can help cushion portfolios when traditional relationships break down.
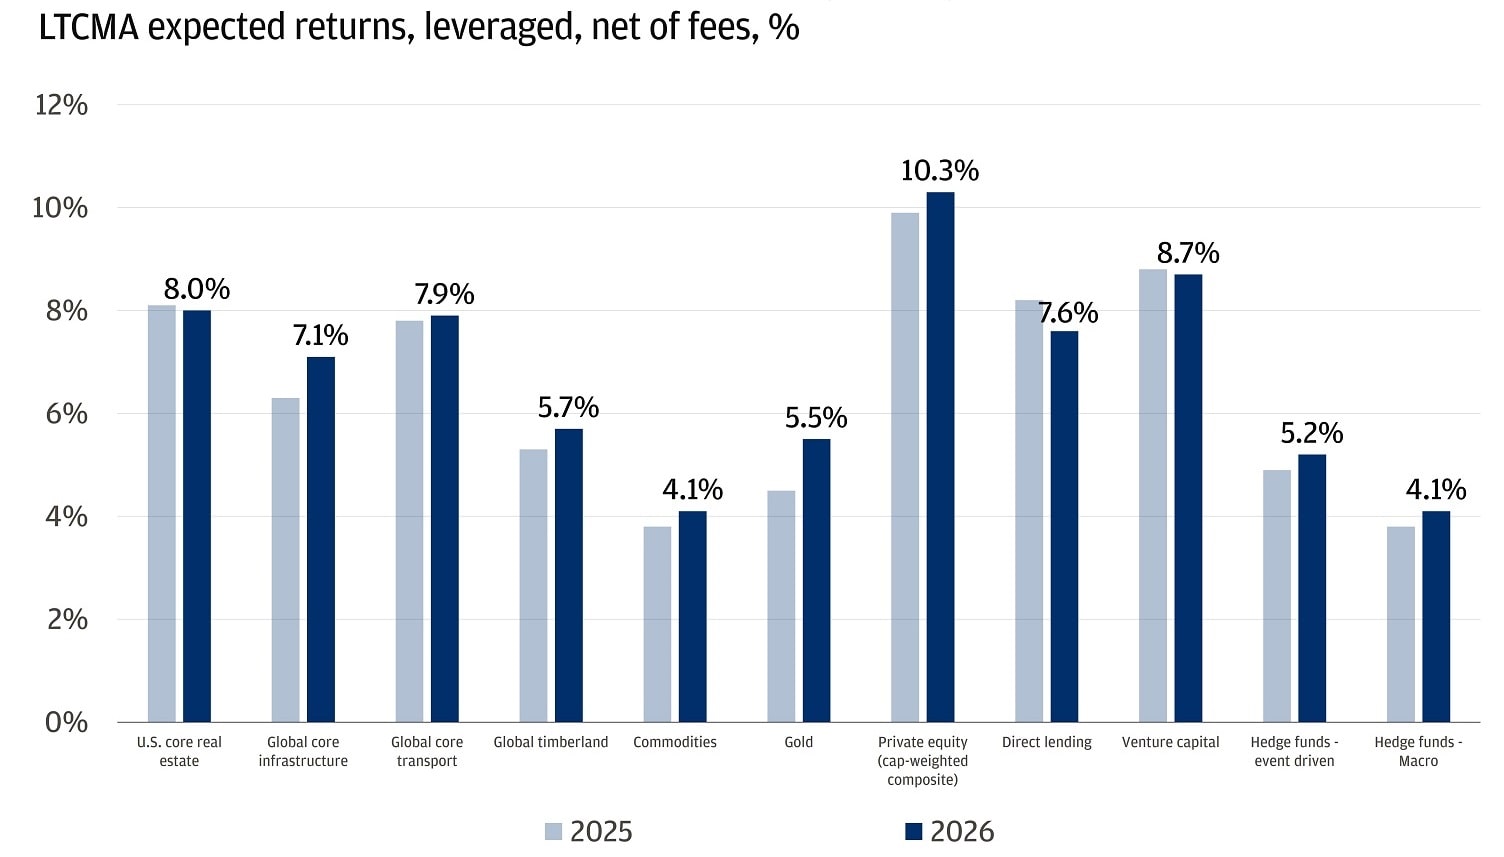
Our 2026 return expectations for real assets and financial alts remain flat - or edge higher
The bottom line
The 2026 LTCMAs are more than just a forecast – they’re a call to action. In a world where policy, technology and market dynamics are all in flux, the LTCMAs provide a disciplined, data-driven framework for making informed decisions. They help investors bridge the gap between short-term concerns and long-term opportunity, turning volatility into a source of strength rather than a risk to be avoided. As always, our team is here to help translate these insights into actionable strategies tailored to each investor’s unique goals and circumstances.
All market and economic data as of 10/24/25 are sourced from Bloomberg Finance L.P. and FactSet unless otherwise stated.
For important disclosures, please refer to the disclosures section for detailed information.
You're invited to subscribe to our newsletters
We'll send you the latest market news, investing insights and more when you subscribe to our newsletters.