The first 100 days: What Trump’s policies mean for investors

J.P. Morgan Wealth Management

Market update
The end of April 2025 marked the end of one of the most volatile months for markets in recent memory.
- The dollar posted its worst performance since November 2022, contracting -4.6%.
- The S&P 500 closed the month down -0.8%, marking the third consecutive month of declines. But the end figure doesn’t begin to describe the intra-month volatility. The large-cap index suffered a -12.1% intra-month decline. No month in the history of the S&P 500 has had at least a 10% intra-month decline and subsequent recovery to positive territory. April 2025 came close, that included a +11.8% recovery from the trough and a +9.5% single-day return on April 9th when “Liberation Day” tariffs were delayed for 90 days, recording the best single day performance since 2008. Those moves caused the level on the CBOE Volatility (VIX) index (a measure of large cap equity volatility) to spike to over 55 – the highest level since COVID-19.
- Volatility didn’t just exist in the equity markets; the 10-year Treasury increased about 50 basis points for the week ending April 11, which is the largest weekly increase since 2001. Since then, longer-dated yields have declined nearly 40 basis points to finish the month up about 12 basis points. In the corporate debt space, issuance slowed in April. U.S. Domestic high-yield issuance stands at $7.9 billion month-to-date (as of April 23), marking the slowest April since 2008.
- Gold gained for the fourth consecutive month, closing +5.3% higher and is up +25% year-to-date. Oil (-16%) had its worst month since November 2021 amid fears of reduced demand caused by a potential economic slowdown as well as OPEC+ plans to increase output.
In macro news, U.S. real gross domestic product (GDP) declined -0.3% in Q1 2025, which was mostly in line with market consensus. A major caveat to the headline print was the distortion of the underlying data due to tariff uncertainty. Net exports contributed -4.8% to GDP (likely from import front loading particularly in pharmaceuticals and computer parts), which is the largest-ever drag on growth from net exports.
Net exports drag on GDP was the largest in recorded history
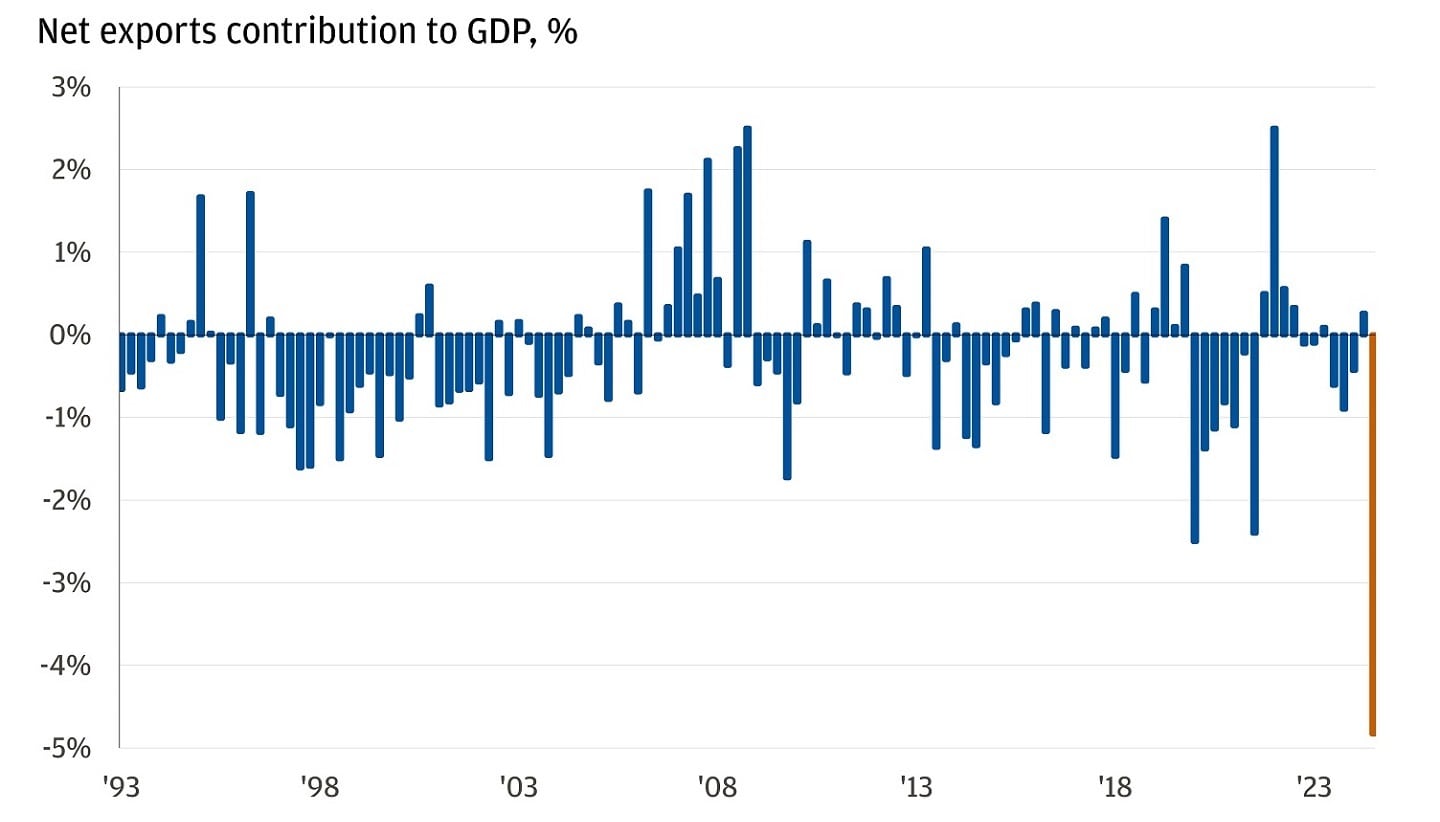
We identified that a less distorted indicator of growth in the economy was domestic demand (consumer spending plus private fixed investment). Domestic demand added 2.5 percentage points to GDP growth, exactly in line with Q4 2024's GDP. The print indicates continued steady growth in the U.S. economy, controlling for import distortions, though weaker growth data is likely on the horizon as the full effect of tariffs takes time to build.
Work with an advisor
Our advisors can provide ongoing financial advice on how your portfolio can adapt to the changes in the market, your life and your goals.
The first 100 days of a president’s term first took on symbolic significance during Franklin D. Roosevelt’s first term in office, when he promised major reforms amid the Great Depression. After he introduced many significant policies during that period, the “first 100 days” of a presidency became a common standard by which to measure future presidents in U.S. politics. This week marked 100 days of President Donald Trump’s second term, which we analyze below.
Spotlight
President Trump has been historically busy during his first 100 days and has signed 142 executive orders, according to the Federal Register and American Presidency Project. Trump hit the ground running, signing 37 executive orders in his first week in office alone (not including other executive actions like memoranda and proclamations). He issued his 100th order in late March, surpassing Roosevelt’s record of 99 in 100 days. We examine the results across three areas below:
1. Tariffs. It wouldn’t be possible to discuss President Trump’s second term without mentioning tariffs. Our Chairman of Asset & Wealth Management Investment Strategy, Michael Cembalest, has been updating the most important chart of 2025 in his Trump Tracker and provides some color in his latest Eye on the Market: Dogespierre Has Left the Building.
We estimate that the effective tariff rate will settle between 10-20%
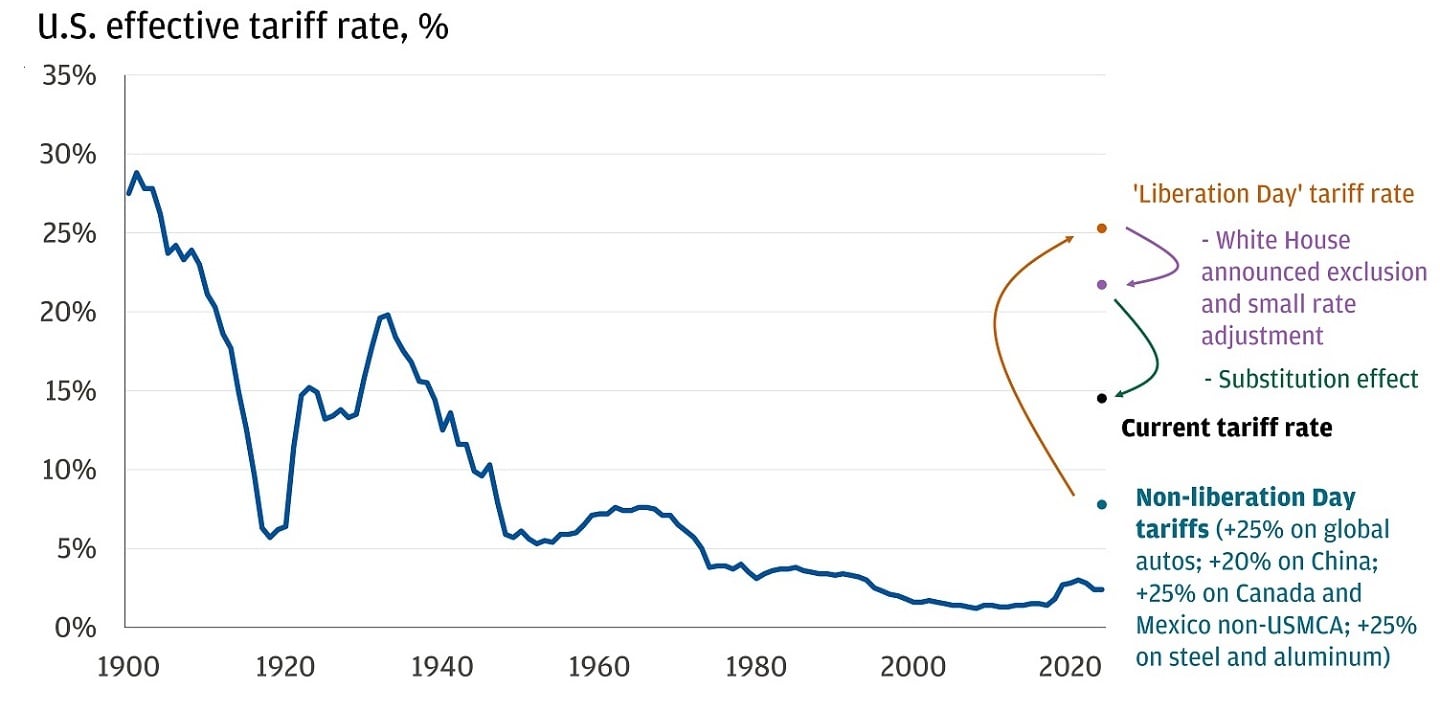
There have been conflicting messages regarding bilateral negotiations between the U.S. and China, further tangling the complex geopolitical thread that has been spinning since April 2. Regardless, our estimates suggest that the current U.S. effective tariff rate is at the highest level since the 1930s.
Businesses face complex decisions as a result of tariffs across inventory and capital expansion projects, which affect economic growth. As for consumers, who are expecting 5% inflation over the next 12 months according to the latest University of Michigan survey, they essentially have two choices: spend now (to get ahead of increased prices) or save (and increase rainy day funds). Which option they choose remains to be seen, but we’ll be watching retail sales, credit card spending data and company commentary for signals of changing behaviors.
The tariff policy and trajectory have been rapidly evolving. Our base case assume deals with trading partners and substitution effects could result with effective tariff rate settling at 10%-20%. This would impact U.S. growth, leading to higher unemployment and inflation, but likely avoiding a recession. Market volatility would persist, affecting earnings, yet investors might benefit from structured notes offering defensive equity exposure and income.
2. U.S. market performance has lagged the rest of the world. 2025 started the year with Wall Street in consensus on U.S. exceptionalism. President Trump’s term was expected to usher in an era of deregulation, continued tax cuts and a release of animal spirits bolstering capital markets activity and performance. Consensus expectation haven’t materialized, and instead has flipped to except-U.S.-alism. Bloomberg’s latest survey showed a 40% median probability of a U.S. recession in the next 12 months according to forecasters.
The U.S. has lagged the rest of the world
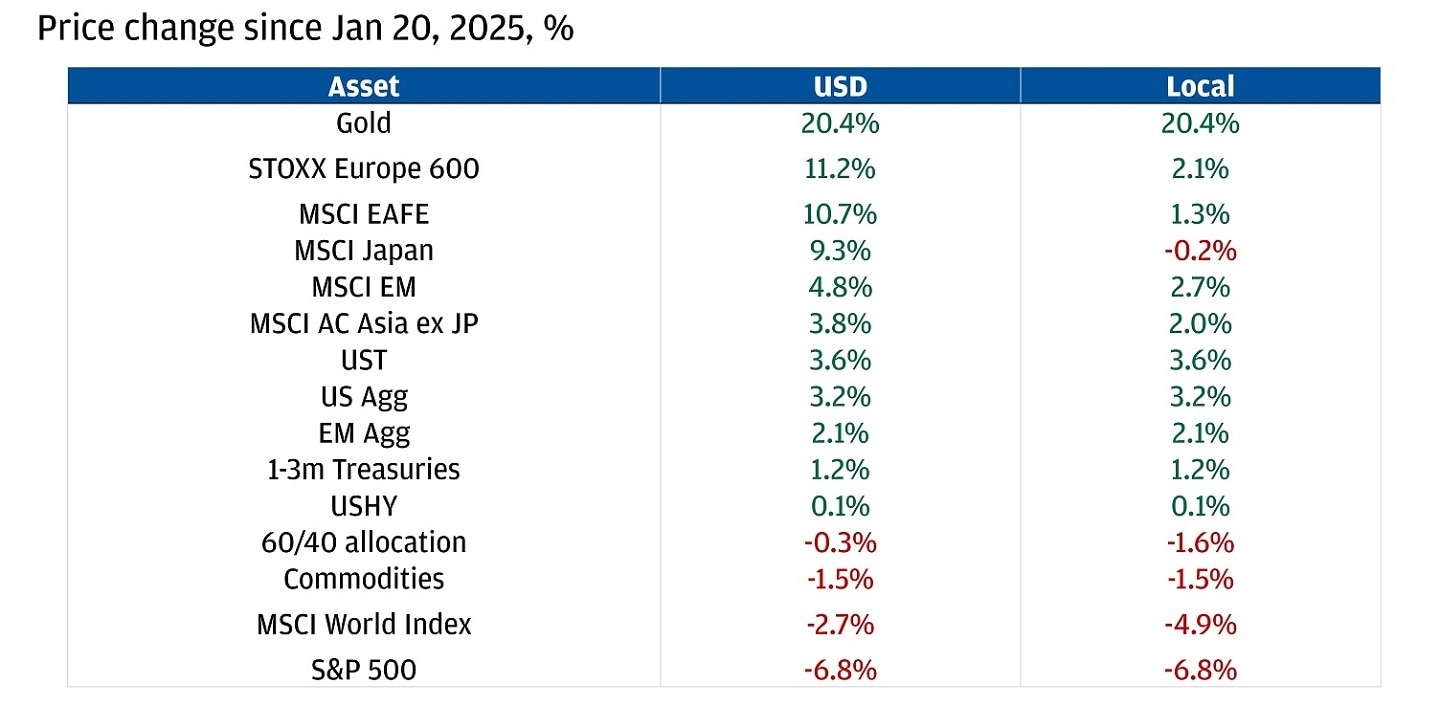
We don’t buy into the view that investors should avoid U.S. assets. In our base case, we believe the U.S. will avoid a recession this year, and in that environment, U.S. equities can still outperform the rest of the world into year-end. However, the outperformance of ex-U.S. assets year-to-date is why we advocate for diversification in portfolios.
Diversification, by definition, means that you won’t have the highest return in a given year, but it creates a smoother ride for investor portfolios. Take, for example, an investor with 100% S&P 500 exposure versus a global 60/40 allocation since the start of 2023. That cherry-picks the starting point before two years of consecutive +20% returns for U.S. equities (which hasn’t happened since the late ‘90s). The returns for both sets of investors are attractive: the U.S.-only investor had a price return of 43% versus 30% for the global investor. The difference is the global investor achieved those gains at approximately 36% less volatility and a smoother investment experience. While the U.S. has outperformed the rest of the world by approximately 2x since 2010, every year an investor doesn’t diversify holdings, is a year actively taking the bet that the trend continues.
The kicker comes in the form of a historically ignored factor for U.S. investors: foreign exchange return. While we do not foresee the dollar losing its reserve currency status soon (nearly 90% of all forex trades involve the USD), capital will likely continue its shift at the margin out of dollars and into other global markets amid downside U.S. dollar risks. One straightforward approach to position for this potential scenario is to shift some of your investments into international markets that aren’t denominated in U.S. dollars, focusing on deep and liquid markets such as Europe and Japan. Using MSCI World as a benchmark, we believe about 30% of a diversified portfolio should be in non-U.S., with two-thirds of that in Europe. This can help reduce currency risk and further diversify sources of return in portfolios. If you’re outside the United States, consider hedging strategies to shield your investments from dollar fluctuations.
3. The deficit: The Trump administration inherited a budget deficit of $1.8 trillion, equivalent to 6.4% of GDP, and aims to reduce it to 3%. The strategy includes generating revenue through tariffs, implementing spending cuts and promoting tax cuts and deregulation to boost GDP.
Senate instructions for budget reconciliation allow larger debt impact than any recent law
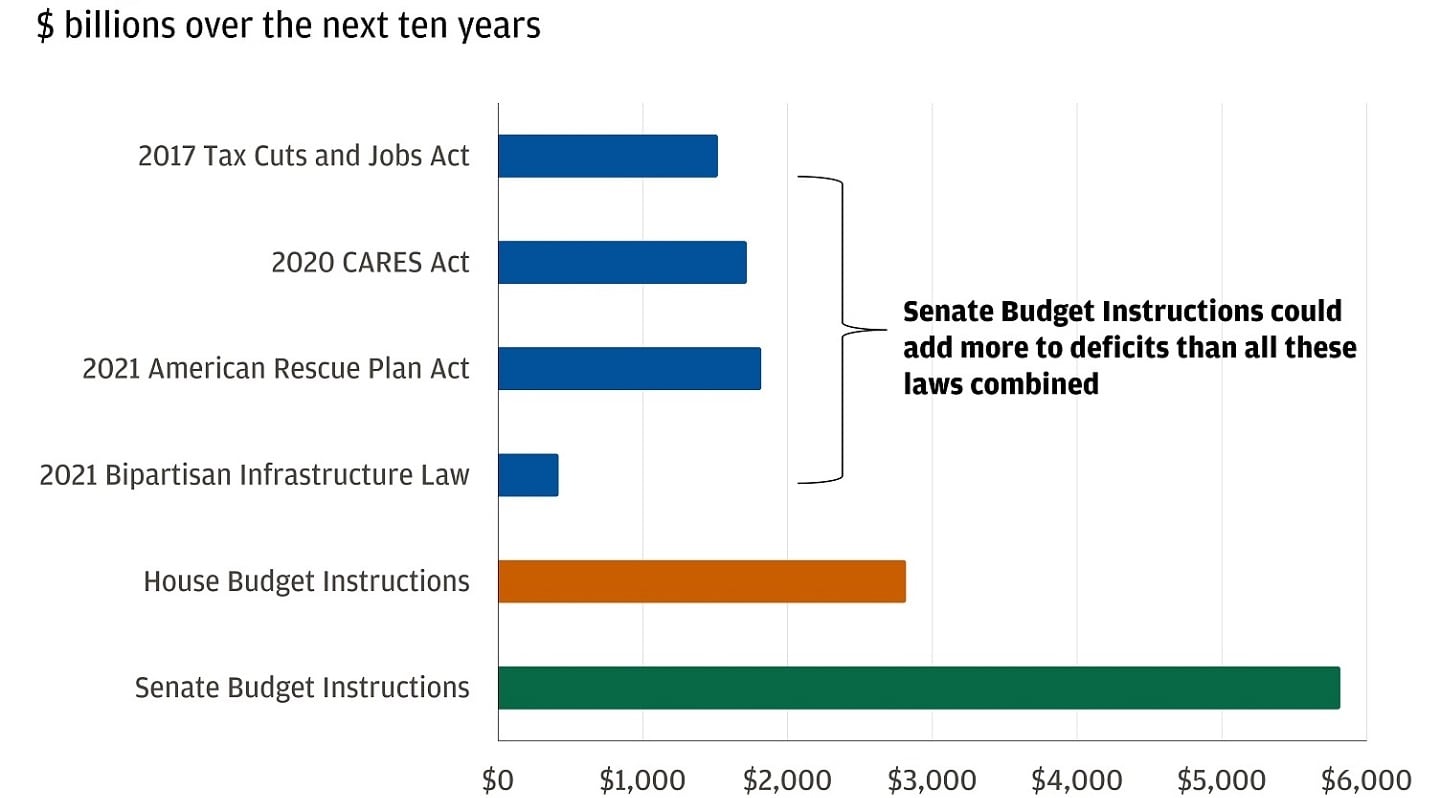
Extending the tax cuts would likely be favorable for U.S. risk assets but come at the cost of adding trillions to the U.S. deficit.
There are essentially three ways to lower the deficit: raise revenues (taxes), lower spending (attempts by the Department of Government Efficiency [DOGE]) haven’t yet shown the ability to lower expenses enough to make a significant difference in the deficit) or increase GDP. For now, it doesn’t seem like the deficit will be moving markedly lower and will remain a risk for investors. The Congressional Budget Office forecasts budget deficits to continue over their forecast horizon.
The CBO expects budget deficits to continue
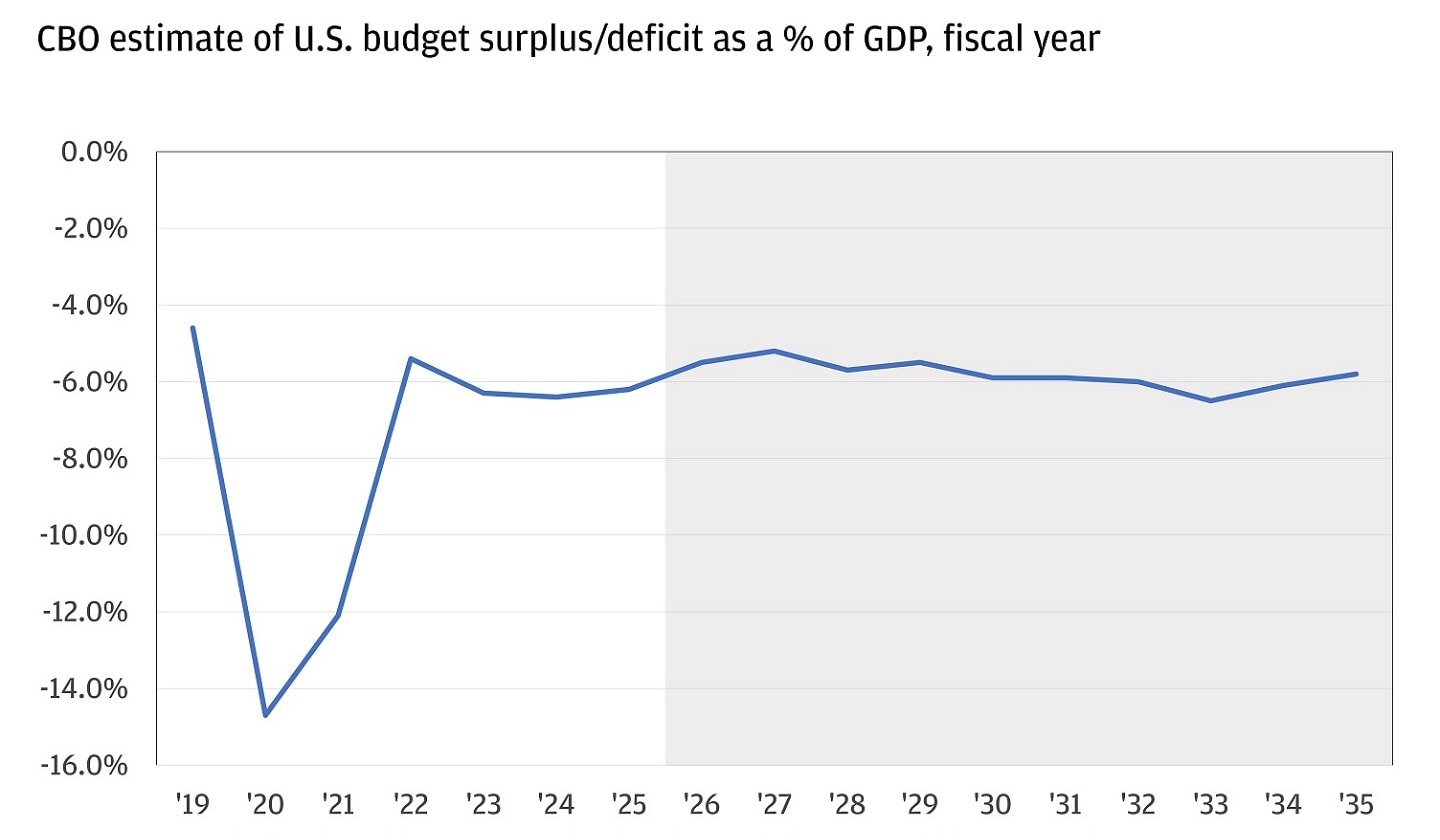
Ongoing concerns about the deficit are likely to contribute to greater volatility in the U.S. Treasury market, or at least alter the risk-reward profile of investing in longer-dated U.S. Treasury securities or securities with a comparable duration. That creates uncertainty and higher yields (term premium) at the longer end of the Treasury curve. To us, we prefer the risk-reward offered at the belly (about 5 years) of the curve and in. This part of the curve is relatively less affected by the trajectory of U.S. debt and macroeconomic uncertainty, and more affected by the Federal Reserve (Fed). We have confidence that the next move the Fed makes is a cut rather than a hike, and as a result, still see the short end as attractive.
Bonus:
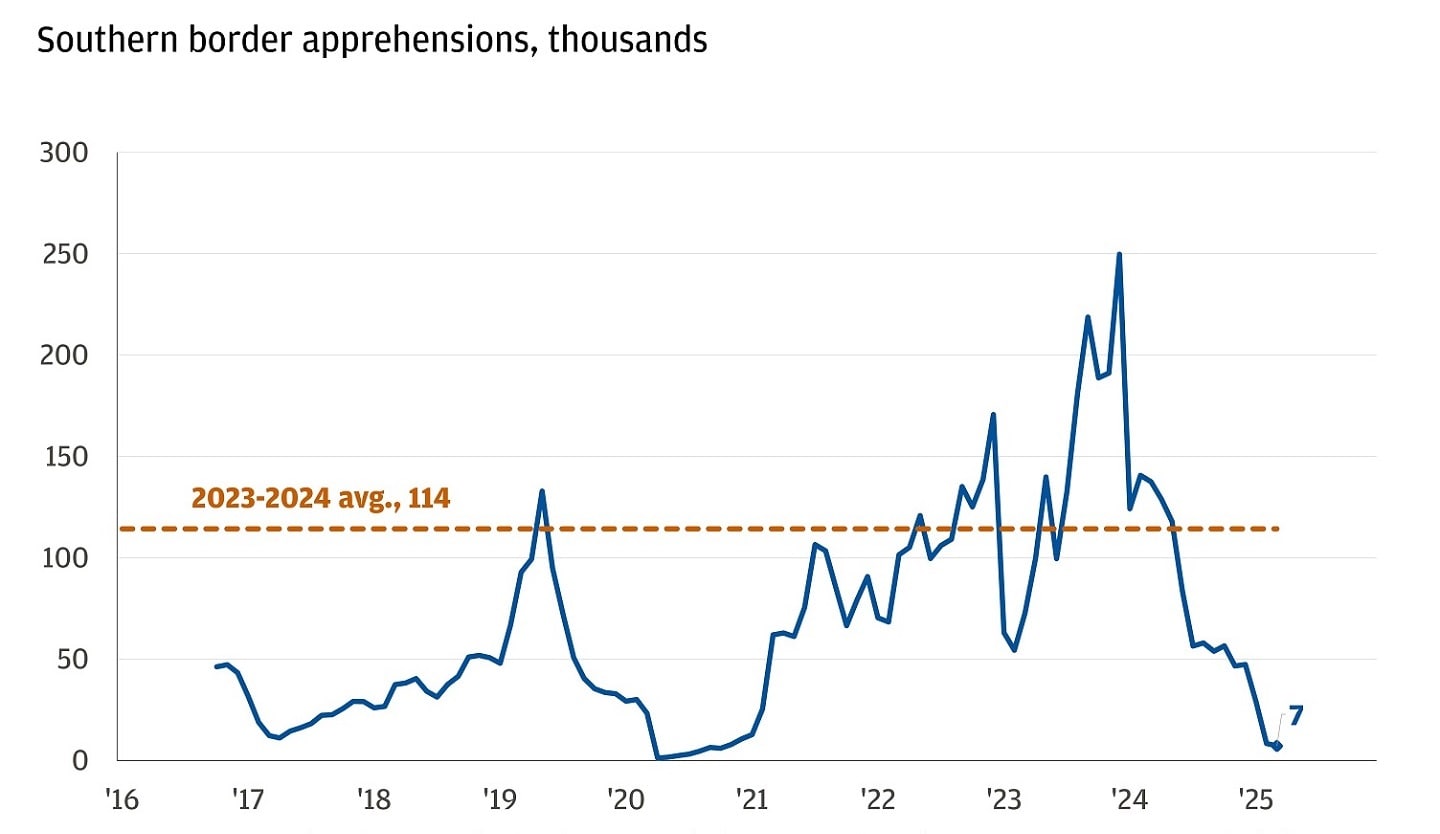
Immigration: President Trump focused on unauthorized migration during his campaign, promising to close the border and initiate a large-scale deportation effort similar to President Dwight D. Eisenhower’s in the 1950s. His administration deployed the military to the border, eased restrictions on Immigration and Customs Enforcement and arranged with El Salvador to detain deported migrants there. U.S. Customs and Border Protection reported that the month of March recorded just 7,180 southwest border crossings, the lowest number in history and a dramatic drop compared to the monthly average during 2023 and 2024 of approximately 115,000.
U.S. border encounters have collapsed
Wondering how to position your portfolio for these trends? Speak with your J.P. Morgan advisor to learn more.
All market and economic data as of 05/02/25 are sourced from Bloomberg Finance L.P. and FactSet unless otherwise stated.
Explore ways to invest
Take control of your finances with $0 commission online trades, intuitive investing tools and a range of advisor services.
J.P. Morgan Wealth Management