Year-end recap: 5 forces beyond AI that moved markets


As we wrap up our last note of the year, here’s a quick look back at the year that was – the bright spots, the curveballs and the catalysts that steered markets.
The biggest story of the year was artificial intelligence (AI), but other events shook markets as well. For this year-end recap, we’re focusing on the five major forces that moved markets beyond AI.
So long, 2025. We’ll see you in 2026.
Policy uncertainty hit its second-highest level on record
The U.S. Economic Policy Uncertainty Index is essentially a policy noise gauge: It measures how often major newspapers are talking about the economy through the lens of policy uncertainty.
In Q1 2025, the index hit its second-highest level in 40 years. The administration had already issued about 110 executive orders by early April, adding to the “moving target” feel for markets.
Policy uncertainty spiked to within 10% of the record
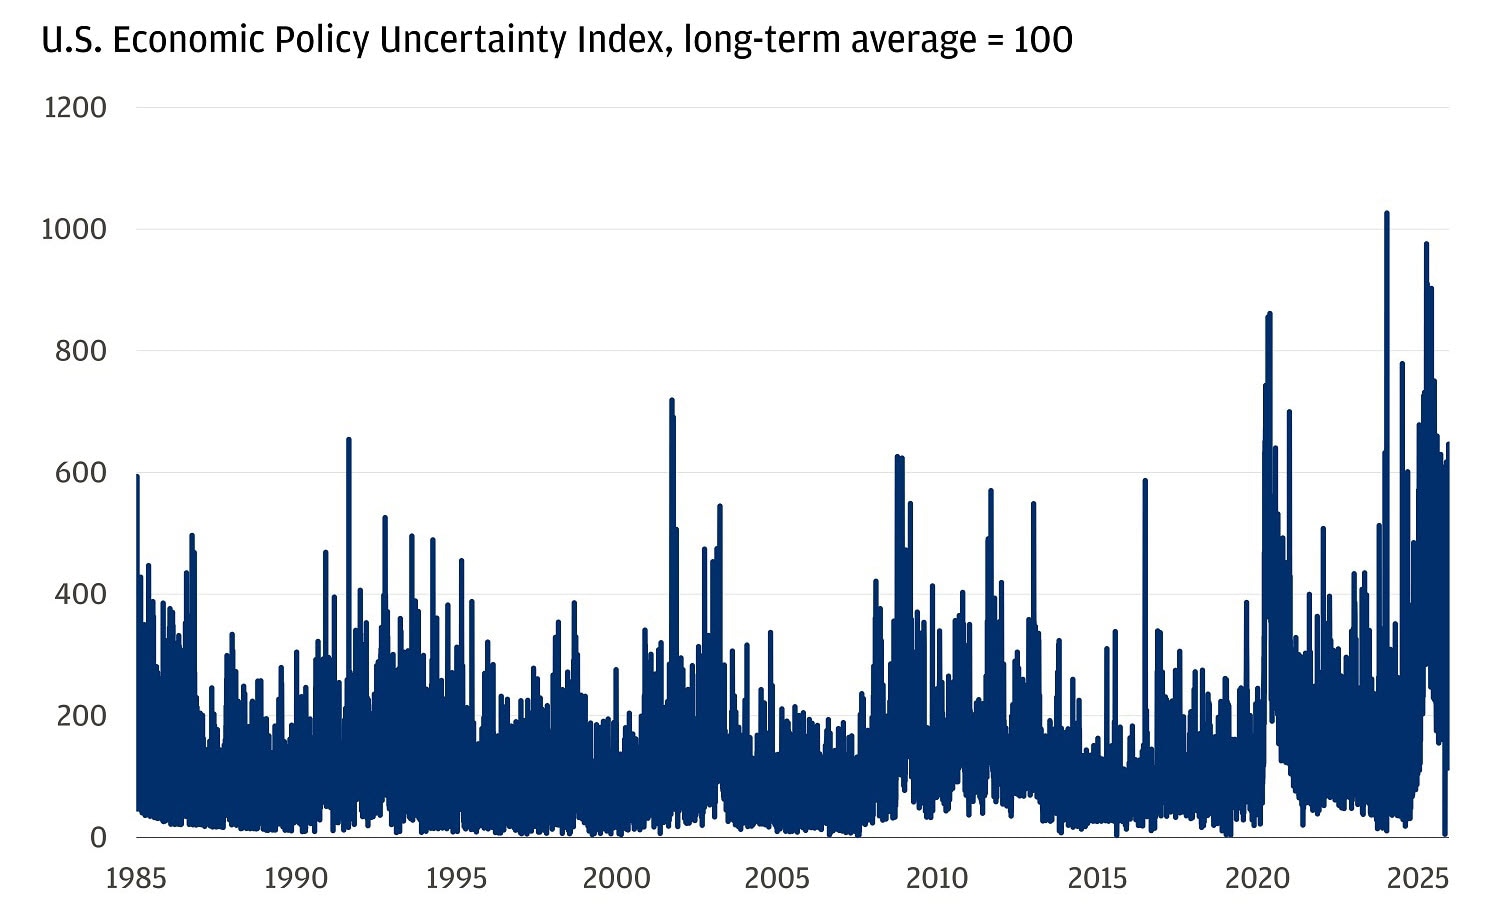
The catalyst was tariffs and the constant back-and-forth surrounding them. The effective tariff rate implied by policy started around 2.5%, but months of conflicting statements and new policies that were quickly retracted made investors unsure of what the long-term policy environment would look like. Voices from the administration at various points cited revenue, leverage and remedying “unfair” trade as arguments for tariffs – when they offered them at all. When the dust settled, effective tariff rate estimates were at roughly 17%, the highest level we’ve seen since 1950.
The lack of visibility had a real market impact. After “Liberation Day,” the S&P 500 suffered its biggest two-day value loss since March 2020 (about $5 trillion) and later flirted with bear-market territory (-20% from the highs) as investors tried to reprice what “next” looked like.
Bottom line: 2025 reminded us that policy isn’t background noise. When the rules (and messaging) keep shifting, it shows up fast in risk premia.
Ready to take the next step in investing?
We offer $0 commission online trades, intuitive investing tools and a range of advisor services, so you can take control of your financial future.
The US dollar fell 10% in the first half of the year, its worst start in 50 years
The growth scare that accompanied the tariff turmoil, plus a repricing toward easier U.S. policy, drove this cyclical move in the dollar. These were amplified by policy uncertainty and deficit concerns that encouraged diversification away from the currency.
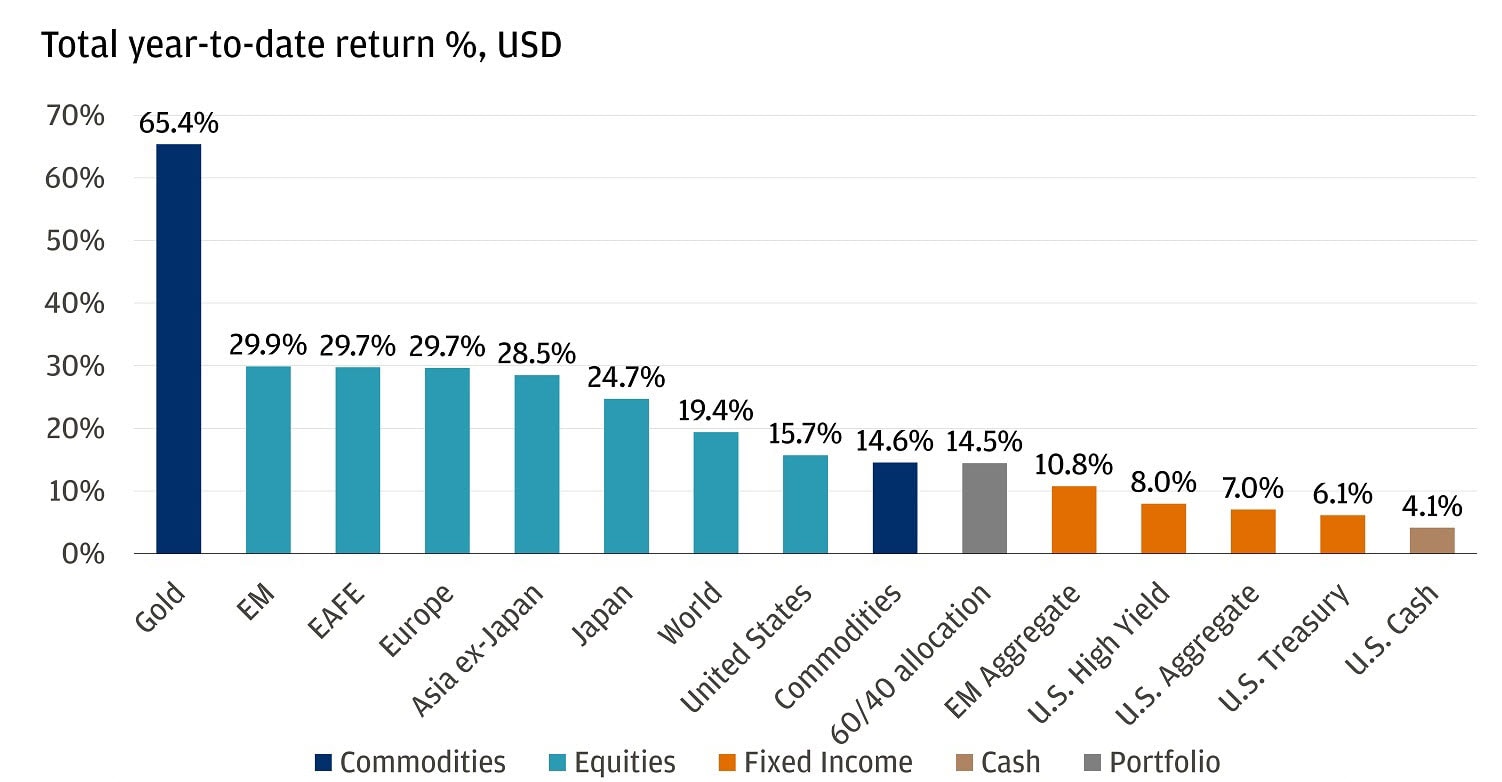
The weaker U.S. dollar, appetite for diversification and a surge in front-loaded exports gave international markets a boost. While U.S. equities did rally in the second half of the year, it was international markets that led the way. Emerging markets are up 30%+ so far (in U.S. dollar terms), with parts of Asia and Latin America delivering outsized gains.
And importantly, traditional “alternatives to cash” didn’t just hold up, they rallied too: gold is up 65% year-to-date, and global investment-grade bonds are up 7.9% year-to-date.
Bottom line: 2025 was a reminder of the power of diversification and why being globally balanced can pay off. A global 60/40 portfolio is up 15% this year.
Global risk assets had a great year
Every NATO ally is expected to meet or exceed the 2% of GDP defense-spending target
Defense spending took center stage in 2025 and helped international markets outperform as well. Every NATO ally is expected to meet or exceed the 2% of gross domestic product (GDP) defense-spending target this year. At the NATO Summit, allies raised the bar further by agreeing to a 5% of GDP commitment by 2035 – at least 3.5% for core defense, plus up to 1.5% for broader security and resilience (think critical infrastructure, supply chains, industrial base).
This isn’t just a military story, it’s also about industrial policy and capital expenditure (capex). Countries are prioritizing domestic production, modernization and capacity expansion, not only in defense but also across infrastructure and other strategic sectors. Germany is the prime example, rolling out significant fiscal stimulus aimed at upgrading infrastructure and supporting industrial growth. The U.S. is leaning in too, with defense spending being framed as a trillion-dollar commitment in 2026. Even private firms are playing a role, as shown by J.P. Morgan’s $1.5 trillion Security and Resiliency Initiative that is working to expand support for critical industries.
Global defense spending is expected to grow 5% by 2030
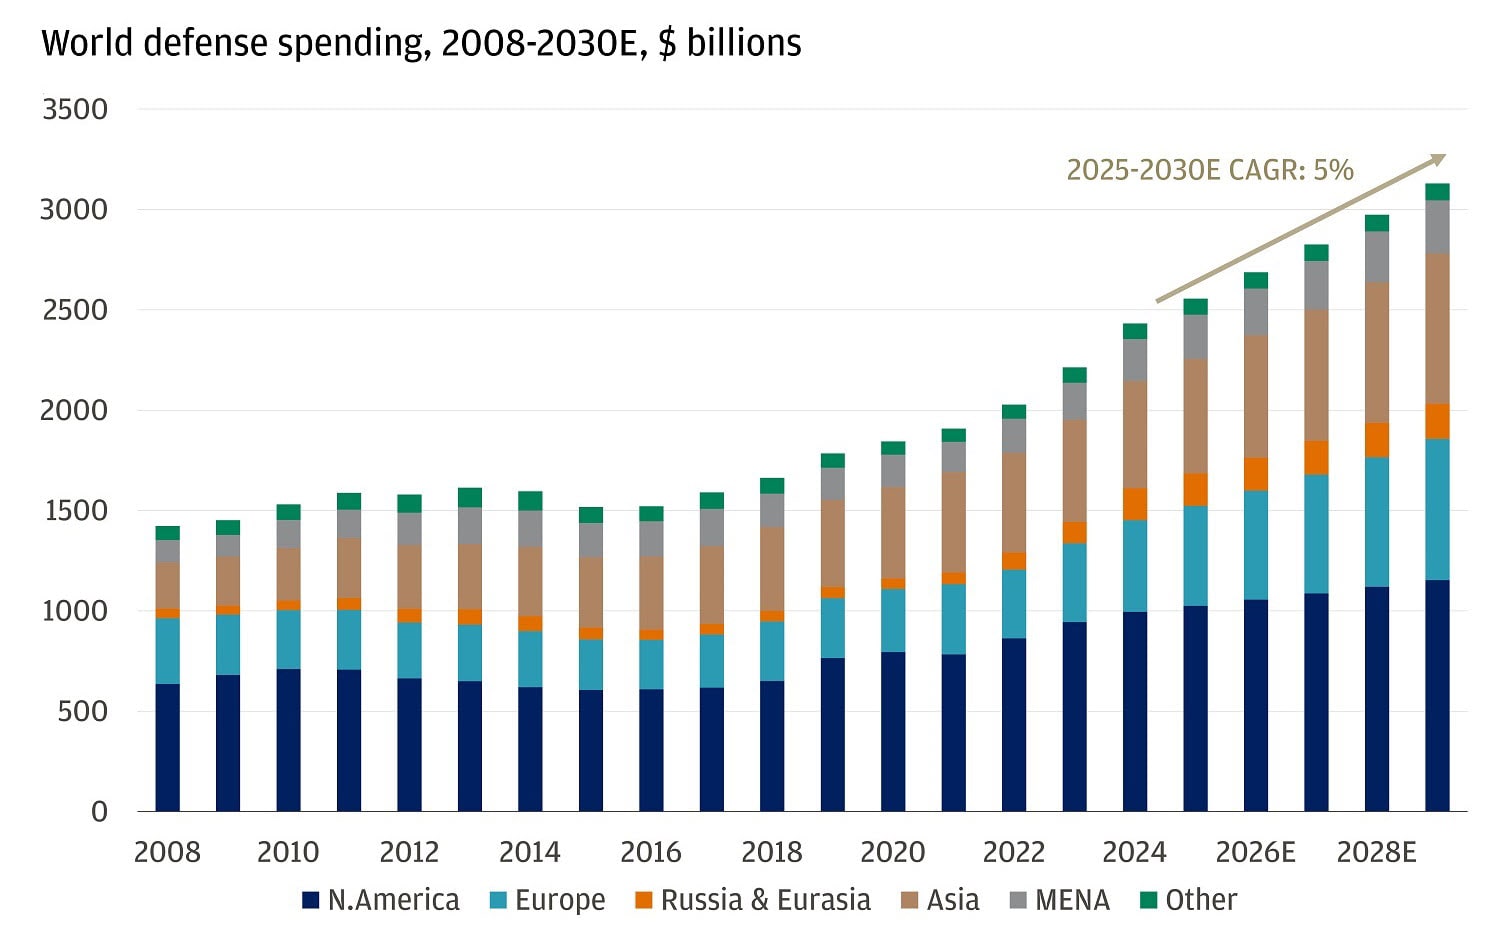
The “why” also hasn’t gone away. The war in Ukraine still doesn’t look close to resolution – President Vladimir Putin has continued to signal that Russia will press its aims. And geopolitics isn’t confined to Europe: U.S.-Venezuela tensions escalated this month, including a “blockade” announcement on sanctioned oil tankers that moved oil prices.
Bottom line: 2025 made it clear that defense spending is structural. These policy shifts are not isolated events, they represent multiyear commitments that are reshaping the global defense landscape.
Global government debt continued its upward trend
Rising spending became a global phenomenon. The International Monetary Fund estimates public debt at about 93% of GDP in 2024, up from around 84% in 2019. And 2025 only doubled down on that direction.
Global debt is on the rise
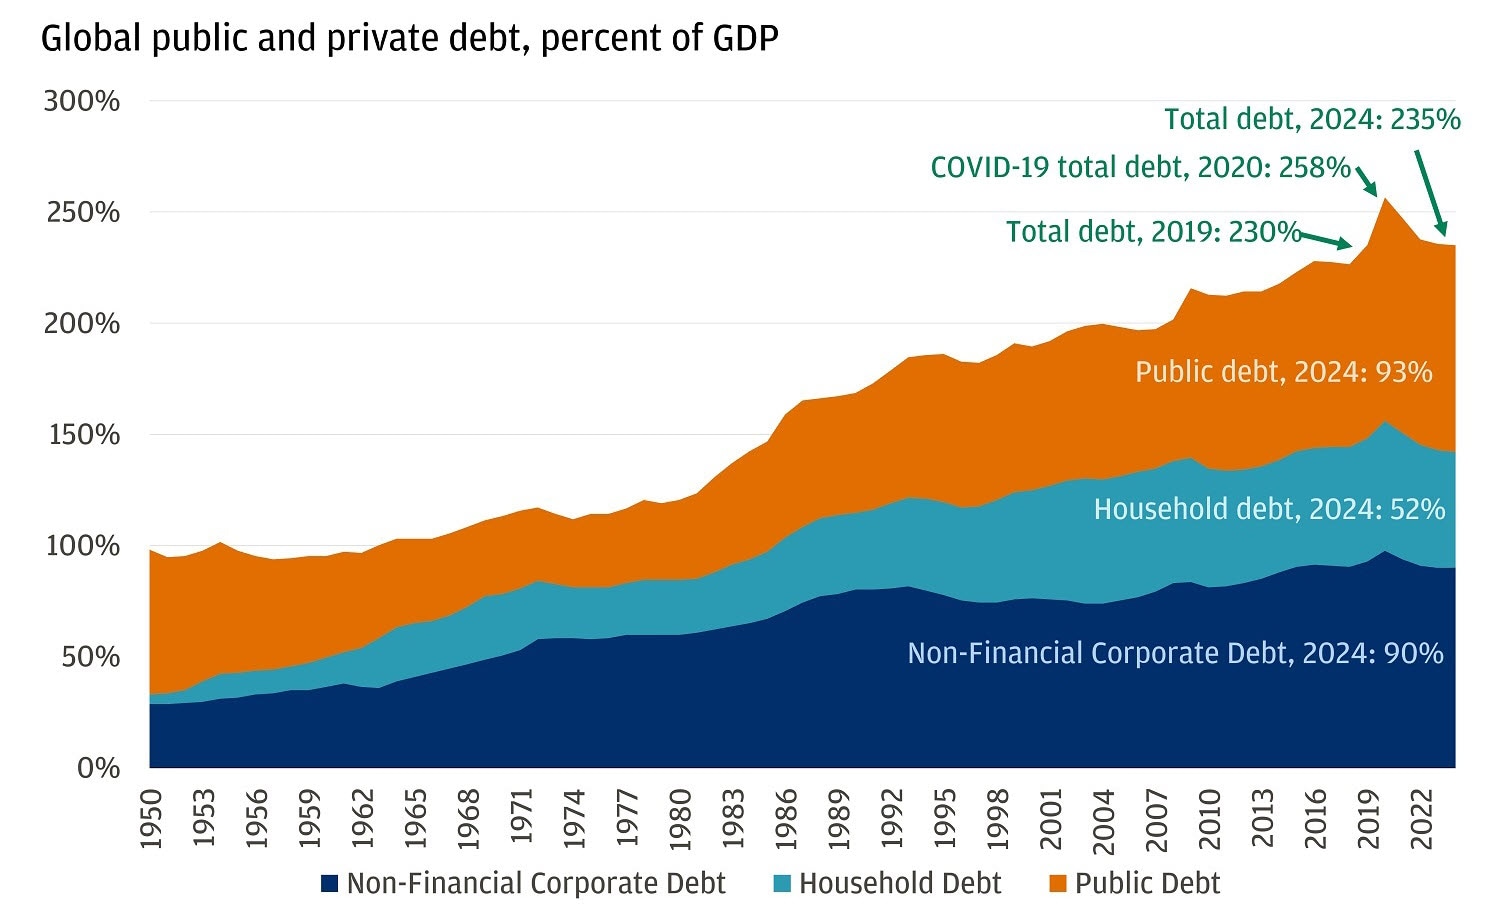
The U.S. is the clearest example. The One Big Beautiful Bill Act (OBBBA) effectively locks in a multiyear fiscal expansion, extending and expanding tax provisions and other measures that, in the Congressional Budget Office’s (CBO) estimate, add roughly $3.4 trillion to cumulative deficits over 2025–2034.
Europe isn’t far behind. Germany, in particular, has made defense and security spending a priority, backed by changes that allow meaningfully more borrowing, with defense outlays projected to ramp up over the second half of the decade.
Said differently, governments are issuing more debt at the same time central banks are buying less of it. This supply/demand dynamic can put upward pressure on yields, especially at the long end. On average, 10-year yields in France, Germany and Japan are up about 55 basis points this year.
Bottom line: In a world of fragmentation and bigger security commitments, government spending was a clear theme. We expect it to continue, which should help boost economic growth. It also means rising sovereign debt levels at a time of less central-bank absorption, which can keep long-end yields elevated.
Last but not least, over 45 central banks cut rates at least once this year – even with inflation still sticky
This marks one of the broadest pivots toward easier policy we’ve seen in years. What made this cycle stand out was why: Central banks increasingly prioritized growth and the labor market, even if inflation wasn’t fully back to target.
That matters because the inflation job isn’t done. In the Organization for Economic Cooperation and Development (OECD), headline inflation was at or below 2% in only 7 of 38 countries (the most common target level across advanced economies).
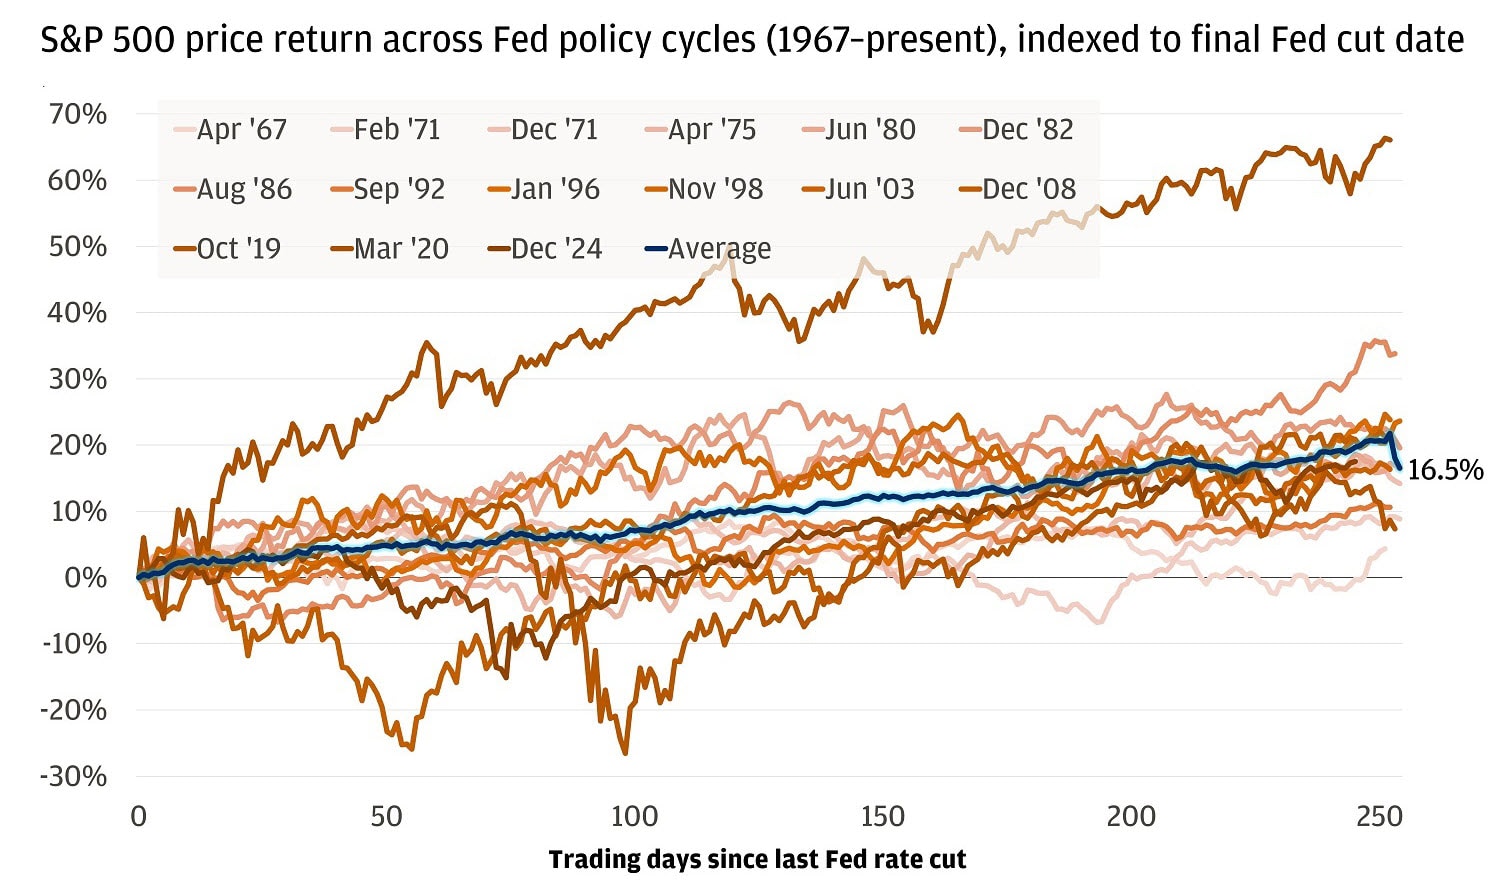
The Fed is a big player here: It ended the year with a third consecutive 25-basis-point cut, taking the target range to 3.5%–3.75%. And easier policy is showing up where it counts: Financial conditions now look supportive, with the Chicago Fed’s gauge implying roughly a 60-basis-point lift to GDP growth over the next year. If financial conditions are indeed turning positive, history is on the market’s side; after the Fed’s final rate cut, equities have rallied the following year in each of the past 15 policy cycles, with an average gain of 16.5%.
Stocks have rallied after the last Fed cut in the past
Bottom line: We see inflation as an important consideration, but not a disruptor for markets in 2026. What really sets the stage for the year ahead is the broad easing in financial conditions, creating a supportive backdrop for investments and markets overall.
Wishing you a happy holiday season and a wonderful new year from all of us at J.P. Morgan.
All market and economic data as of 12/19/25 are sourced from Bloomberg Finance L.P. and FactSet unless otherwise stated.
You're invited to subscribe to our newsletters
We'll send you the latest market news, investing insights and more when you subscribe to our newsletters.