Differentiating large from small: Firm size and exposure to trade tensions

Global Investment Strategist

Market update
There was no summer news slowdown in July. Fiscal policy, monetary policy and corporate earnings remained at center stage.
- President Donald Trump signed the One Big Beautiful Bill Act, both extending 2017 tax cuts and adding additional incentives to boost consumer demand and business investment. Trump delayed the 90-day tariff deadline to August 1 and throughout the month, announced new trade deals with several key countries, including Japan, South Korea, Vietnam and the European Union (EU). Notably, the administration announced a higher tariff rate on India, Brazil, Switzerland, Taiwan and Canada. They also put in place another 90-day extension with Mexico as negotiations are ongoing. Taking it all together, we expect the average effective tariff rate to reach 15% to 20% by year-end, the highest since the early 1900s.
- Economic data continued to show a U.S. economy that is slowing, in line with our expectations, but not breaking. We believe the first quarter’s real gross domestic product (GDP) print of -0.5% understated growth, while the second quarter’s print of 3% overstated it, mostly due to swings in trade data. Averaging across both quarters, real GDP growth was 1.2%, which feels more accurate.
- The Federal Reserve (Fed) kept interest rates on hold, as expected. Fed Chair Jerome Powell was noncommittal on the path of rate cuts in the second half of the year, but we still anticipate that the Fed will be in a position to cut rates by 50 basis points by year-end, given expected softness in the labor market.
- The headlines kept coming, yet U.S. equity markets kept climbing. The S&P 500 made 10 new all-time highs during the month. July challenged artificial intelligence (AI) skeptics as better-than-expected earnings and capital expenditure (capex) guidance were reported by both Meta and Microsoft.
However, while large-cap equities continued to make new highs, the relative weakness in small-cap companies became more apparent. Below, we outline why trade tensions are likely having a more material impact on smaller-sized companies versus their larger peers.
Work with an advisor
Our advisors can provide ongoing financial advice on how your portfolio can adapt to the changes in the market, your life and your goals.
Spotlight
In the face of the highest average effective tariff rates in the last century, the strength of the S&P 500 over the past few months has many wondering: Are equity markets really a consistent representation of the health of the U.S. economy?
The short answer: Not exactly, but it depends on where you look.
A clear trend emerges in this year’s returns when examining market cap sizes. The S&P 500 (large cap) has outpaced the S&P 600 (small cap) by roughly 11 percentage points. This disparity became more pronounced as tariff concerns grew in mid-February, with small caps facing a steeper decline in April (-21%) compared to large caps (-14%) during the height of tariff fears.
Large cap outpacing small cap so far this year
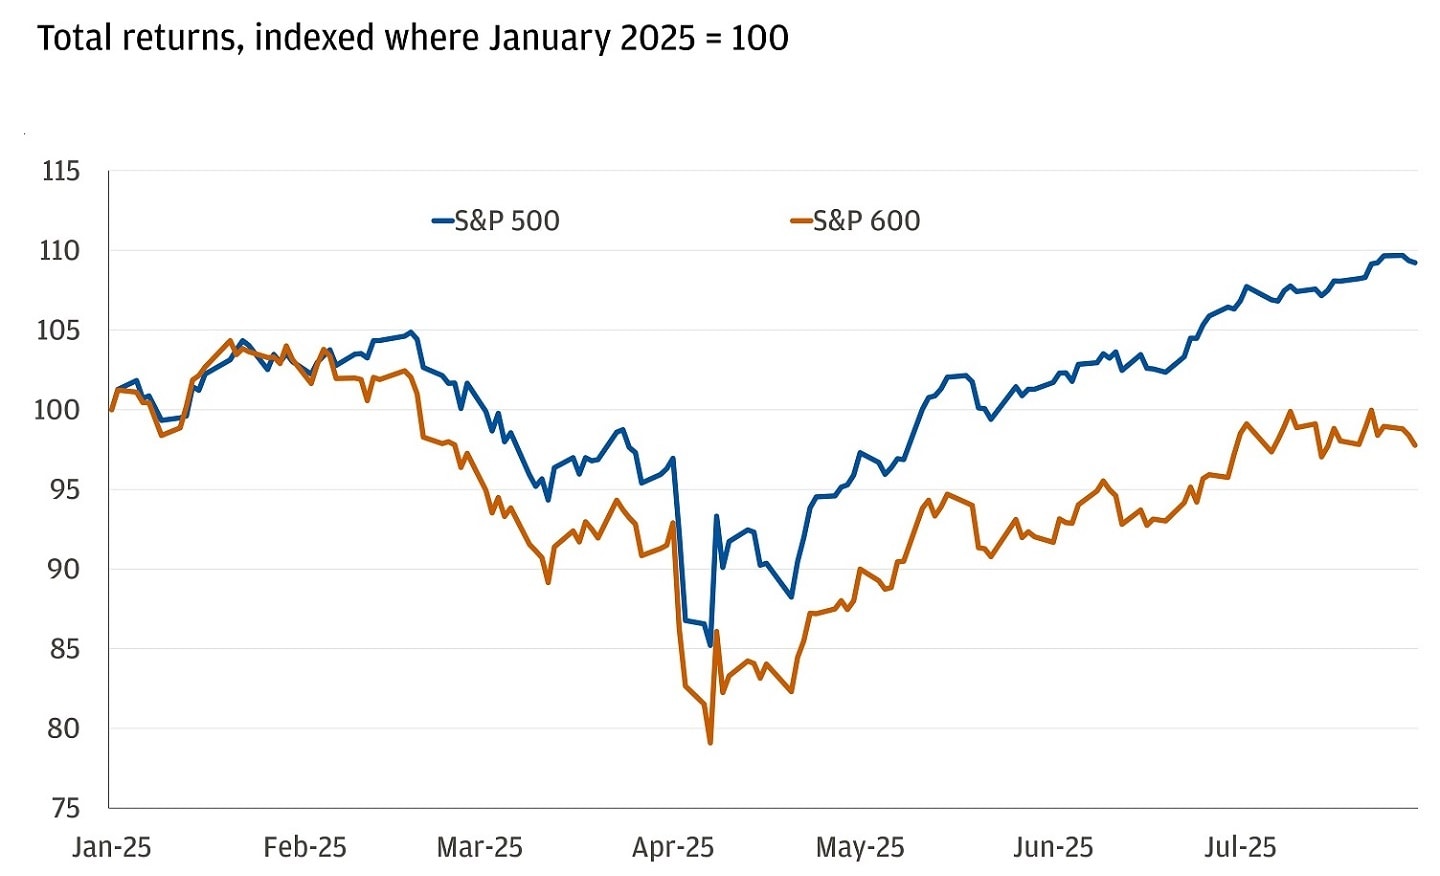
Importantly, scale matters. Small companies (S&P 600) tend to have lower profit margins in aggregate (about 6.5% versus about 13% for large caps), are more leveraged (current net-debt to earnings before interest, taxes, depreciation and amortization [EBITDA] of roughly 3.7x versus 1.3x for large caps) and have smaller market caps ($1 billion vs. about $15 billion for large caps). This could limit their pricing power, fixed-cost absorption and ability to diversify supply chains. It’s also worth mentioning that smaller firms tend to have smaller legal and accounting teams that can utilize more complex strategies to navigate changes in tariff policy. It’s no surprise then, that three-month earnings revisions for small caps show an increasingly negative growth trajectory for 2025 and 2026.
With trade tensions still ongoing, let’s delve into three key factors that influence how tariffs might impact smaller importing companies more than the large corporations that make up the S&P 500: Limited trade partners, a larger reliance on China and a greater difficulty in passing through higher costs to consumers.
1. Limited import partners – so not a lot of options
A potential advantage for large companies, particularly those in the S&P 500, is their ability to quickly reconfigure supply chains. For instance, recent trade data shows India has surpassed China as the largest exporter of smartphones to the U.S. A company like Apple, with its size and scale, can optimize supply chains to benefit from varying tariff rates across countries. The question for smaller companies is: How many import partner countries do they have compared to larger firms?
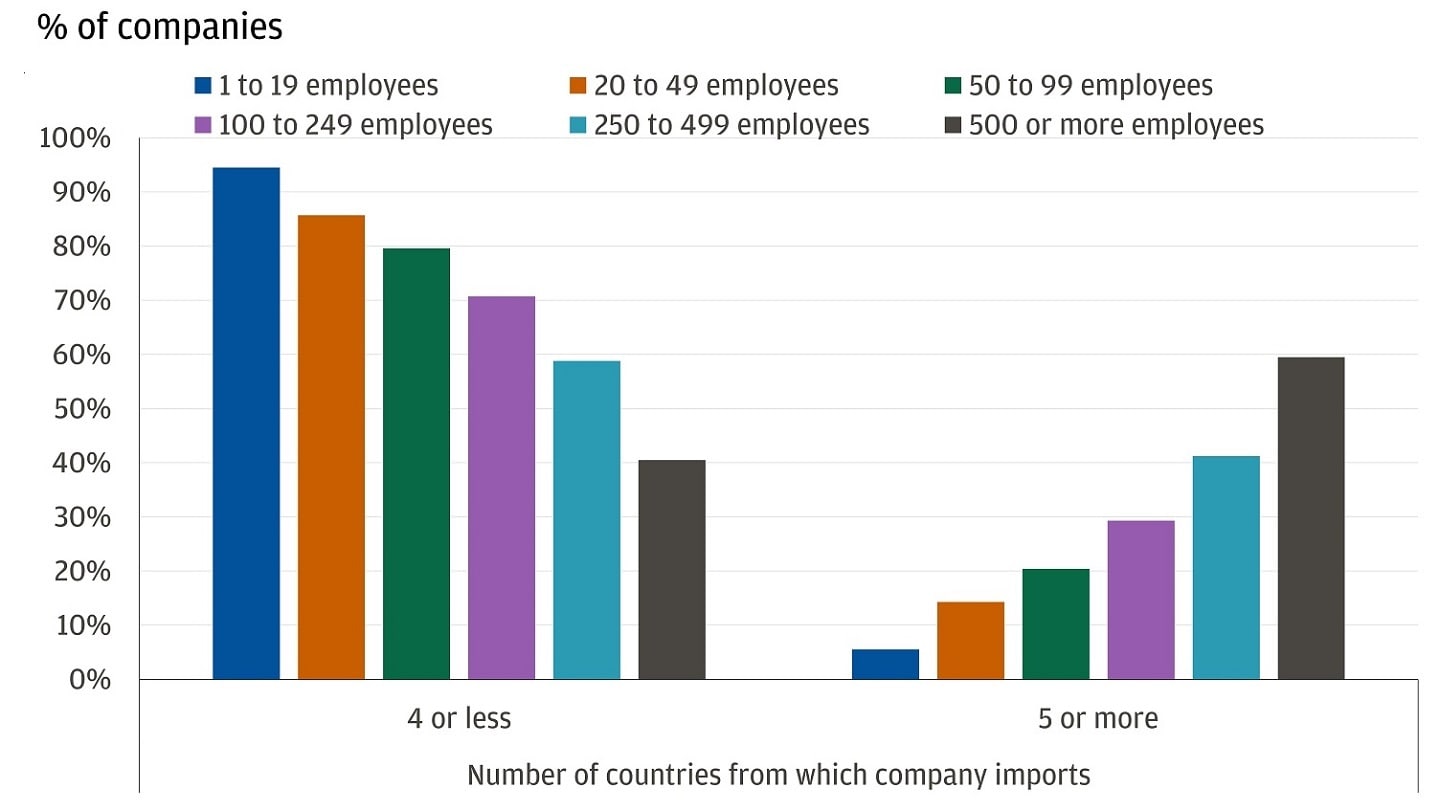
From 2020 import data compiled by the U.S. Census Bureau, it’s clear that smaller importers have less diversified supply chains, which makes sense given their relatively limited capital. In fact, 94% of firms with one to 19 employees import from just one to four countries, while close to 60% of firms with 500+ employees import from five or more countries. Consequently, small and medium companies face more concentrated supply chains and likely lack the flexibility of larger firms to quickly navigate varying tariff rates.
Smaller companies tend to have fewer import partner countries
2. More exposure to China – one of the countries with steeper tariffs
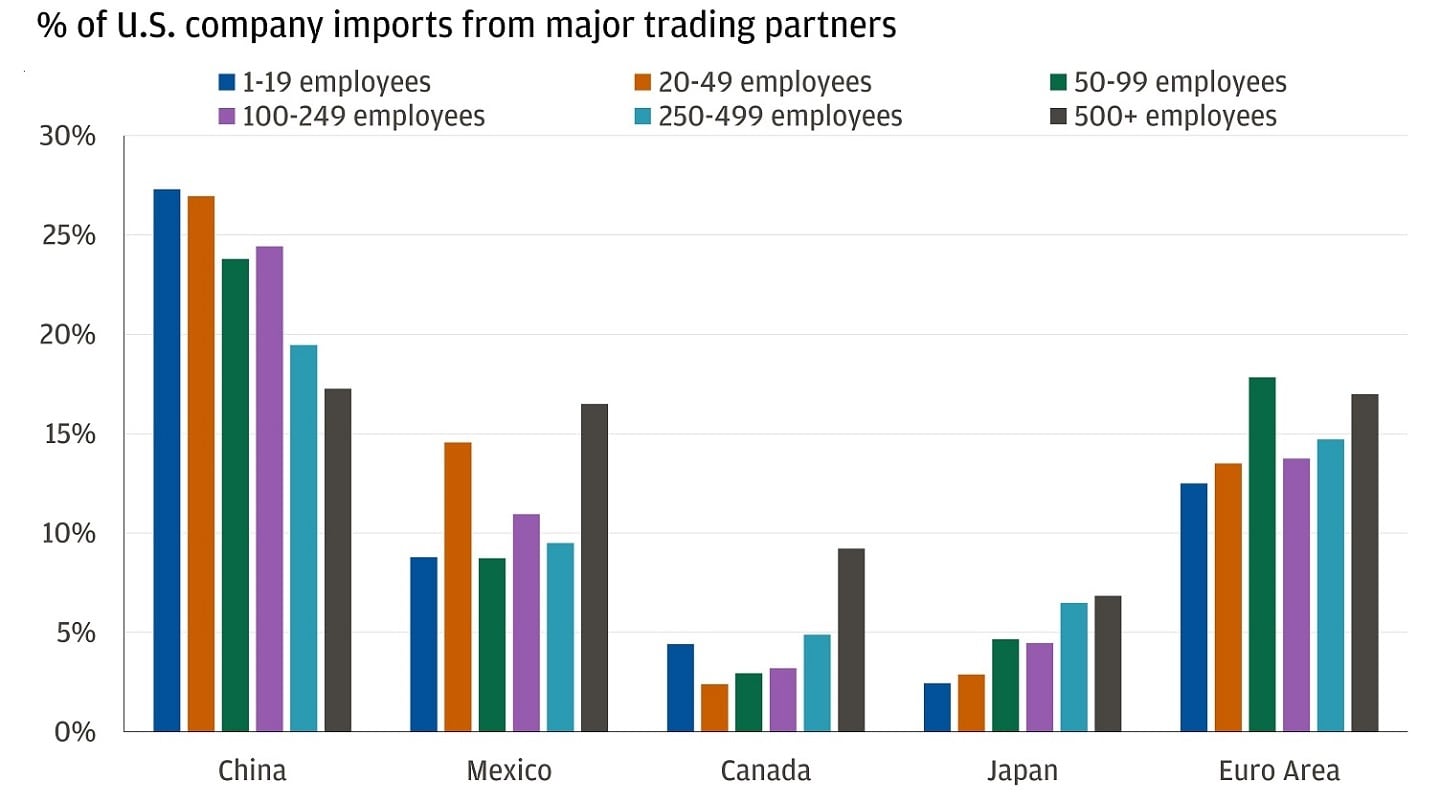
The data also reveals that small and medium companies are more exposed to China than larger corporations. With China’s status as the “factory of the world,” it’s logical for these importers to source primarily from there (at least in the beginning). Larger companies also rely on China but maintain a more balanced import distribution – with China, Mexico and the euro area each contributing around 17%. In other words, this reliance on China means smaller businesses may face higher tariff rates, depending on where trade negotiations settle. At the moment, the average effective tariff rate on China stands close to 50%, which remains well-above most other major trading partners.
Smaller companies have a greater reliance on China than their larger peers
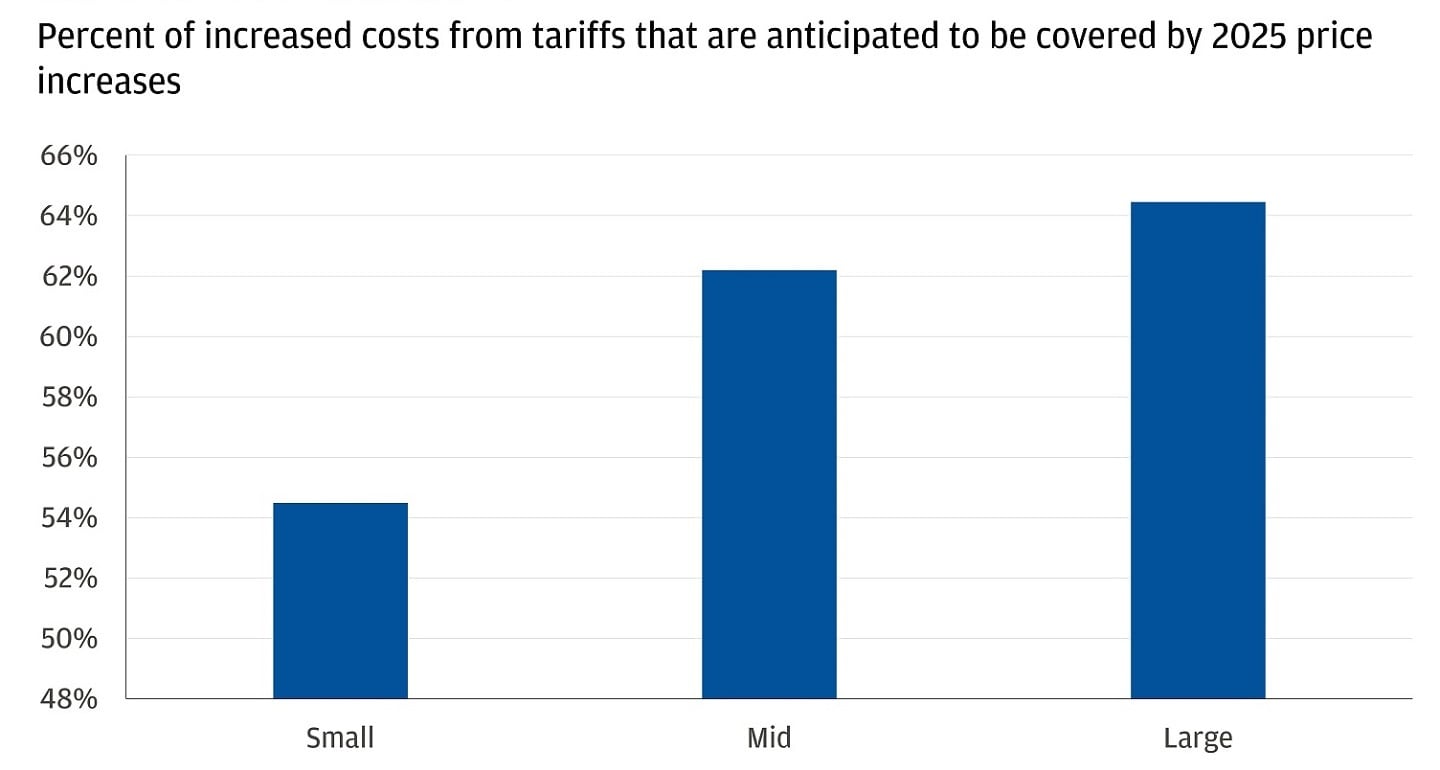
3. Lower expected pass-through rate to consumers
U.S. companies paying tariff duties on imports have only a few options: Absorb the cost through lower profit margins, pass it on to consumers or some combination of the two. A recent survey conducted by the Federal Reserve Bank of Atlanta indicates that smaller companies have a lower expected pass-through rate to consumers than larger firms. As shown in the chart below, small businesses expect to cover about 54% of increased tariff costs through 2025 price increases, compared to 65% for larger firms.
Small businesses expect to pass on less of the tariff cost to consumers
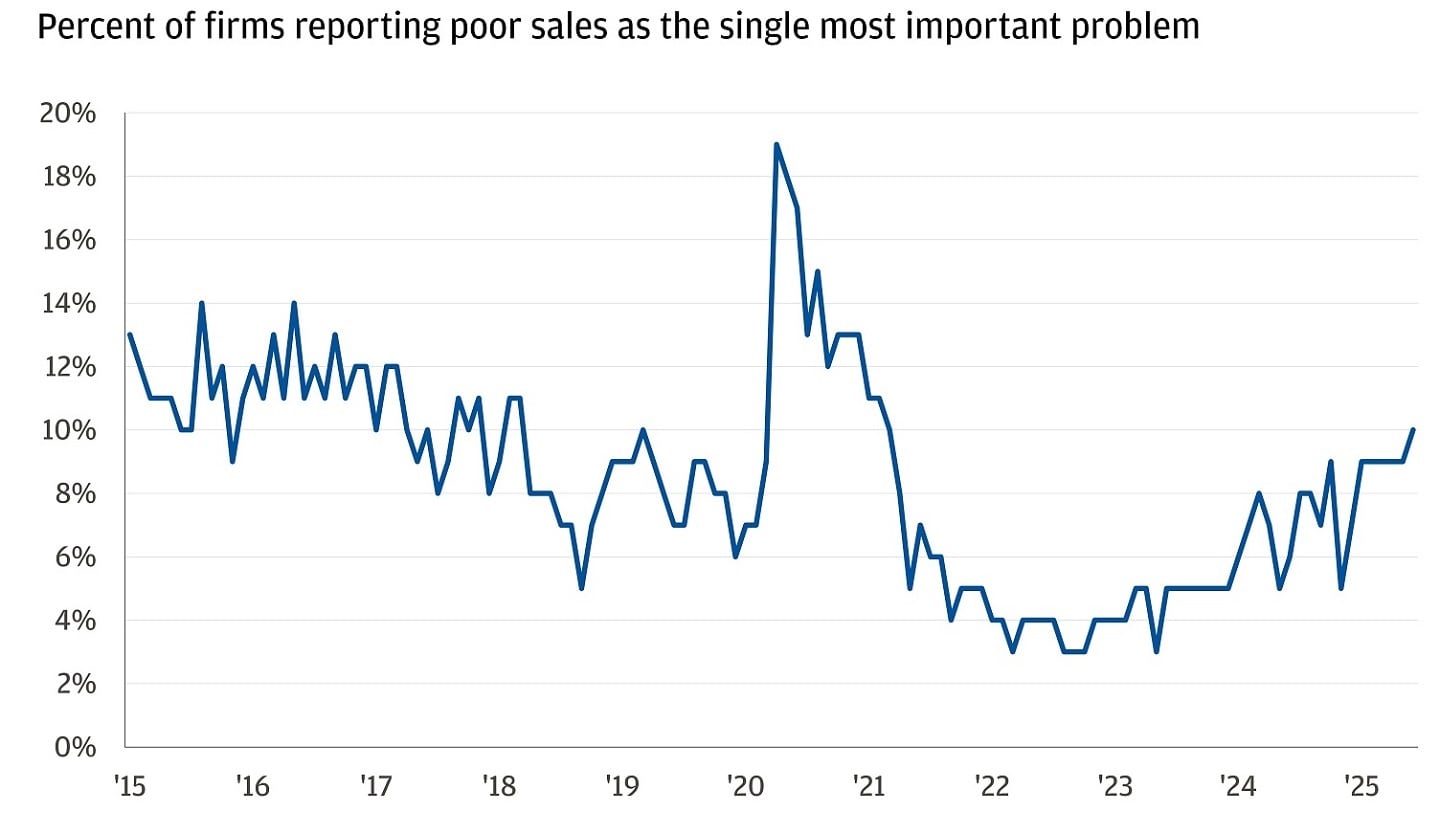
Several factors could make it challenging for smaller businesses to pass on higher costs, such as less brand recognition, customer loyalty and limited negotiating power with manufacturers. Additionally, research has shown that pass-through rates correlate with perceived consumer demand. A Federal Reserve Bank of Atlanta study found that companies with normal or higher-than-normal sales levels expect to pass on more cost increases from tariffs. The latest data from the National Federation of Independent Business, which conducts surveys across smaller businesses notes that weak sales is becoming a more frequently cited problem. In other words, smaller firms are likely to experience more profit margin compression than larger companies when faced with higher prices.
Small businesses increasingly citing poor sales as a problem
The bottom line
We anticipate that smaller importing firms could have a harder time navigating elevated trade tensions due to fewer trading partners, greater reliance on China and structural challenges in passing costs to consumers. With smaller businesses (one to 99 employees) having accounted for close to 40% of U.S. employment growth over the last decade, we see their ongoing challenges contributing to the overall growth slowdown we expect this year. Meanwhile, we believe larger multinational corporations are better positioned with higher starting profit margins, more trading partners, less overall exposure to one country for imports and more robust corporate management teams, to navigate ongoing trade tensions. Going forward, while there are potential long-term tailwinds for businesses of all sizes from the One Big Beautiful Bill and advancements in AI, our near-term investment strategy continues to favor U.S. large-cap equities over smaller cap U.S. stocks.
Reach out to your J.P. Morgan advisor to discuss how this is relevant to you and your portfolio.
All market and economic data as of 08/01/25 are sourced from Bloomberg Finance L.P. and FactSet unless otherwise stated.
Explore ways to invest
Take control of your finances with $0 commission online trades, intuitive investing tools and a range of advisor services.
Global Investment Strategist