US household income hit a record in 2025: How do you compare? And why does it matter for investors?

Editorial staff, J.P. Morgan Wealth Management
- Median U.S. household income rose to a record $87,460 in 2025, according to Census data released in September. That’s the highest on record since 1967.
- That figure is adjusted for inflation, and because it represents the median rather than the mean, it isn’t disproportionately affected by high earners.
- While you can compare your own household income with the median, it’s important to review other measures, such as debt, savings and investments, when assessing your financial health.

The median income for U.S. households reached a record high of $87,460 in 2025, according to data released by the Census Bureau in September. This marks the first time the measure has climbed above its pre-pandemic level. When adjusted for inflation, median household income last peaked in 2019 at $85,210 (shown here in 2025 dollars) before sliding for three consecutive years and beginning a gradual recovery in 2023.
What the Census report means by 'record household income'
Household income data combines all earners within a household, whether that’s one individual, multiple family members or a group of roommates.
The Census Bureau uses median data, rather than a mean average, to identify the midpoint of the household income distribution. It also adjusts for inflation to calculate what economists call “real” income. That allows for more accurate historical comparisons.
How do you compare? A quick, practical framework
To calculate your own household income, add up the pre-tax income of all earners and compare it to the 50th percentile, or the median, which was $87,460 in 2025.
US household income percentiles 2025
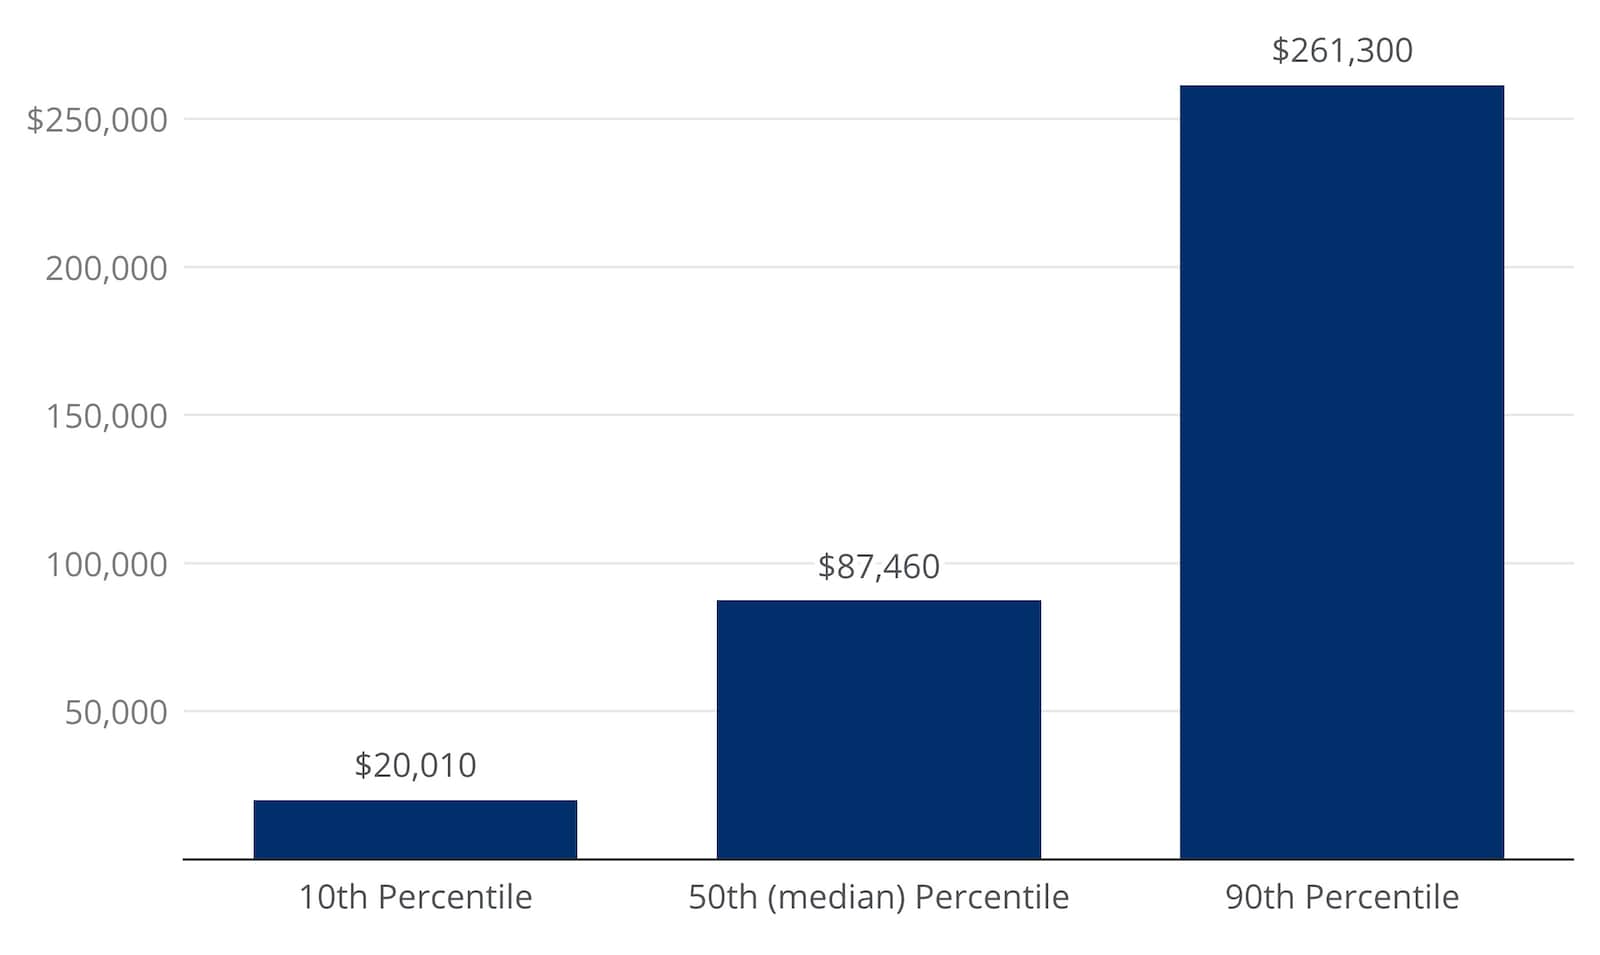
Keep in mind, though, that household income and percentile may not allow for an apples-to-apples comparison. For example, a married couple may earn more than a one-person household. Older people tend to earn more than younger people, too. And it bears mentioning that women earned 84% of what men did in 2025, compared with 81% in 2024, so a household with two women may earn less than a household with two men.
The data also doesn’t account for cost of living – $87,460 may go further in a small city than a major metropolitan area, for example. Beyond the overall median, the Census report includes median income broken down by household size, age, education, race and other metrics.
Median household income by selected characteristics
| U.S. Household Segment | 2025 Median Income |
|---|---|
| All households | $87,460 |
| Composition | |
| Family households | $112,900 |
| Non-family households | $52,200 |
| Female householder (non-family) | $45,430 |
| Male householder (non-family) | $60,970 |
| Race | |
| White, not Hispanic | $96,710 |
| Black | $59,980 |
| Asian | $126,300 |
| Hispanic (any race) | $73,260 |
| Age | |
| 15 to 24 | $60,870 |
| 25 to 34 | $94,880 |
| 35 to 44 | $114,100 |
| 45 to 54 | $120,100 |
| 55 to 64 | $99,320 |
| 65 and older | $59,680 |
| Education level | |
| No high school diploma | $37,090 |
| High school, no college | $60,790 |
| Some college | $79,880 |
| Bachelor’s degree or higher | $138,300 |
Source: U.S. Census Bureau, September 15, 2026
Get up to $1,000
When you open a J.P. Morgan Self-Directed Investing account, you get a trading experience that puts you in control and up to $1,000 in cash bonus.
Why household income matters for investors (and what it doesn’t tell you)
For investors, income trends may matter because household pay supports consumer spending and the ability to save and invest. Even so, the headline median doesn’t tell you how evenly gains are distributed – or how much households can invest after housing, debt and other costs.
Greater income can enable you to save and invest more consistently and in larger amounts. Higher earners may find it easier to establish an emergency fund and to pay off debt more quickly.
But remember, income is not the whole picture of financial health. Household income doesn’t show what’s going out the door each month – housing costs, childcare, healthcare, debt payments and other spending can matter just as much as what’s coming in. It also doesn’t account for savings, assets like property value, or whether there are kids at home.
How you can use this info to make wise decisions
Knowing how your income compares with the median can be a useful reference point when plotting a financial course, but financial flexibility depends on your full picture – including expenses, savings, debt and time horizon. That context may affect how comfortable you feel taking on investment risk. For example, if you feel confident you won’t need to touch your investments for many years, you may consider a portfolio weighted more toward stocks than bonds.
It also serves as a reminder to monitor your spending. It’s natural to spend more as your income grows, whether on a big purchase like a new home or smaller ones like more dinners out. Even high earners can fall into lifestyle creep, where rising expenses erode the ability to save and invest.
What if your income is above typical benchmarks?
If you have more flexibility with your income to invest, the waterfall approach is one strategy you can consider when it comes to money management. It works like this: Start by allocating money each month toward an emergency fund. It is commonly recommended by financial professionals to save three to six months of expenses as a baseline, but you may want to set aside even more, depending on your situation. You can hold that money in a more liquid account, too, such as a high-yield savings or money market account.
Once that target is reached, the income waterfall spills into the next tier, which is matched investments like employer 401(k)s. If you’re contributing enough to earn the full employer match, you may consider contributing to other tax-advantaged accounts like a health savings account (HSA), individual retirement account (IRA) or 529 plan. Then, you might allocate the remainder of the waterfall to taxable investments, which could include securities like stocks, index funds or bonds.
If your income is near the median
If your household income is near the national median, you may want to focus on saving what you can and taking advantage of any employer-sponsored accounts with a contribution match. Even if you contribute less than the amount required to receive the full match, receiving a partial employer contribution is better than receiving none. And if your income goes up, consider increasing your contribution rate.
You can also consider automating savings and investments so that funds are allocated to priority accounts before the decision to spend or save arises. It may also prevent idle cash from piling up without a plan.
If your income is below the median
First, remember that half of all households are below the median – and for a variety of reasons. Smaller households, early-career earners and households in places with a lower cost of living may all have lower-percentile incomes, for example.
Next, consider building a budget that tracks all your income and expenses. Small but steady investments in an emergency fund and investment account may compound over time and help support your financial well-being.
If you have debt, you may want to prioritize paying off high-interest debt first. This can be an efficient way to keep debt from growing due to interest charges month to month.
You don’t necessarily have to cut out all discretionary spending, but it may help to be as consistent as you can.
If you want help translating your income, savings rate and goals into a saving and investing plan, consider working with a financial professional.
The bottom line
It may be helpful to understand how the median U.S. household is doing and where you compare with that benchmark when assessing your own financial well-being. Median income reached a record in 2025, and that’s meaningful since it shows that U.S. workers are earning more – which can really help when inflation rises. However, one household’s $87,460 income may look quite different from another’s, depending on household size, location and other factors. Whatever your income percentile, a household’s financial plan should take into account expenses, savings and future goals.
Frequently asked questions about household income in the U.S.
Median household income measures the midpoint of income for U.S. households. Unlike mean average income, the median isn’t inflated by the outlier incomes of the highest earners.
An income percentile is a measure of how a single data point compares to the larger whole. For example, a 60th-percentile income is higher than 60% of household incomes measured by the Census Bureau.
Not necessarily. More money coming in may give you more flexibility to take on additional risk and invest with a longer time horizon in mind, depending on your financial picture.
Nominal income is the actual number on your paycheck, while real income is adjusted to account for inflation. The latter is “real” in the sense that it allows for more accurate historical comparisons of purchasing power.
Invest your way
Not working with us yet? Find a J.P. Morgan Advisor or explore ways to invest online.