‘Liberation Day’ in retrospect: 6 things that surprised investors

Global Investment Strategist

Six months ago, President Donald Trump’s “Liberation Day” tariffs hit like a shockwave. Overnight, U.S. duties surged from 2.5% to 25% – the biggest import tax hike in modern history and a gut punch to global supply chains. Economies braced. Investors panicked. “Recession” dominated headlines.
But the fear faded fast. This week also marks six months since the market bottom. Since then, a global 60/40 stock-bond portfolio has climbed over 20% – despite bouts of volatility, including a recent dip after President Trump threatened even steeper tariffs on Chinese goods. Major indexes haven’t just bounced back – they’re hitting fresh highs. What looked like a breaking point sparked a historic rally.
Here are six ways the past six months defied expectations – and reshaped the outlook.
Tariffs promised decisive change – but delivered confusion
Instead of quickly ushering in a new trade order, the months since have brought a blur of rule changes, carve-outs and legal battles. The Congressional Research Service has counted 26 tariff actions this year. At least eight federal lawsuits have followed, with two of them now before the Supreme Court.
This back-and-forth explains why U.S. tariffs average 18% on paper, but companies are effectively paying closer to 11%. Yale’s Budget Lab estimates that new tariffs have added $88 billion in extra customs revenue through August – about 60% of the $146 billion collected so far in 2025.
These are big numbers, but they fall short of what full implementation would suggest – held back by exemptions, timing lags, delayed payments, and some even finding ways around the rules. As enforcement ramps up and trade flows adjust, that gap is expected to narrow. And the back-and-forth isn’t over: Just this week, Trump threatened even steeper tariffs on Chinese goods in response to new export controls and interventions by Beijing, sending major indexes into the red – a reminder that tariff headlines still move markets.
Major policy called for fast action – but Washington shut down
Partisan battles and political paralysis followed fast. Case in point: The government is now in its 10th day of shutdown. Markets have barely flinched – so far, it tracks with history – but the longer the shutdown drags on, the higher the cost. Each week of closure is estimated to shave 0.1–0.2 percentage points off quarterly U.S. gross domestic product (GDP) – a modest but compounding drag, with 2026 appropriations still in limbo. The impact typically reverses once funding resumes, since furloughed workers – currently 40% of the federal civilian workforce – generally receive back pay.
The bigger issue is data. At least seven key economic reports – including last week’s nonfarm payrolls – have been delayed. Economists are adjusting by leaning on private-sector indicators like the ADP National Employment Report and the Worker Adjustment and Retraining Notification (WARN) index.
But if the shutdown persists, critical inflation data could be missed, leaving the Federal Reserve (Fed) and investors flying blind. Still, markets expect two more Fed cuts this year, one at each remaining meeting, right in line with the dot plot.
Ready to take the next step in investing?
We offer $0 commission online trades, intuitive investing tools and a range of advisor services, so you can take control of your financial future.
Recession fears surged – but the economy held steady
Liberation Day supercharged recession fears. Downturn odds doubled to 40%, and over 80% of U.S. CEOs expected a recession. More than 70% of S&P 500 companies mentioned “tariffs” in earnings calls.
Yet the economy held steady. Tariff-driven inflation wasn’t as severe as feared, and companies were well-positioned to avoid major layoffs. S&P 500 net margins remained solid at 12.3% in the second quarter of 2025 – just below the first quarter’s 12.7% and above the five-year average. Now, the third quarter is on track to be the ninth consecutive quarter of earnings growth, a streak last seen in 2018.
Artificial intelligence (AI) and automation have reshaped the growth story. Tech+ firms now make up nearly half the S&P 500’s market cap. Capital spending contributed nearly half of U.S. GDP growth in the first half of 2025, marking a shift away from consumption-led expansion. Innovation and investment have helped the economy weather the storm.
Uncertainty intensified – but corporate America adapted fast
“Liberation Day” rattled corporate America. Guidance turned cautious. Hiring slowed dramatically. The latest Challenger Report shows hiring plans at their lowest since 2009, with just under 205,000 new jobs announced in 2025 – a 58% drop from last year.
However, companies didn’t sit still. Strong balance sheets and healthy margins enabled them to adapt – diversifying supply chains, near-shoring, adjusting pricing and investing in tech to manage costs.
About 60% of U.S. businesses have said they are considering reshoring production, according to a recent KPMG survey of 300 executives. Only about one in ten have started, but the White House’s own tracker is already brimming with major manufacturing pledges – from Apple and Nvidia to Ford, General Motors, Bristol Meyers Squib and Biogen.
Most of those plans are still on paper – and include some previously announced commitments – but the pace of the shift shows how quickly U.S. companies can pivot under pressure.
Markets braced for a bear market – but the bull run raged on
For a moment, the bull market looked over. Major indexes flirted with a 20% drop – the technical threshold for a bear market – before momentum flipped. Since then, the S&P 500 has surged over 35%, marking one of the strongest six-month rallies since 1950 and nearly doubling gains from the bull run that began in late 2022.
The S&P 500 could be close to doubling again
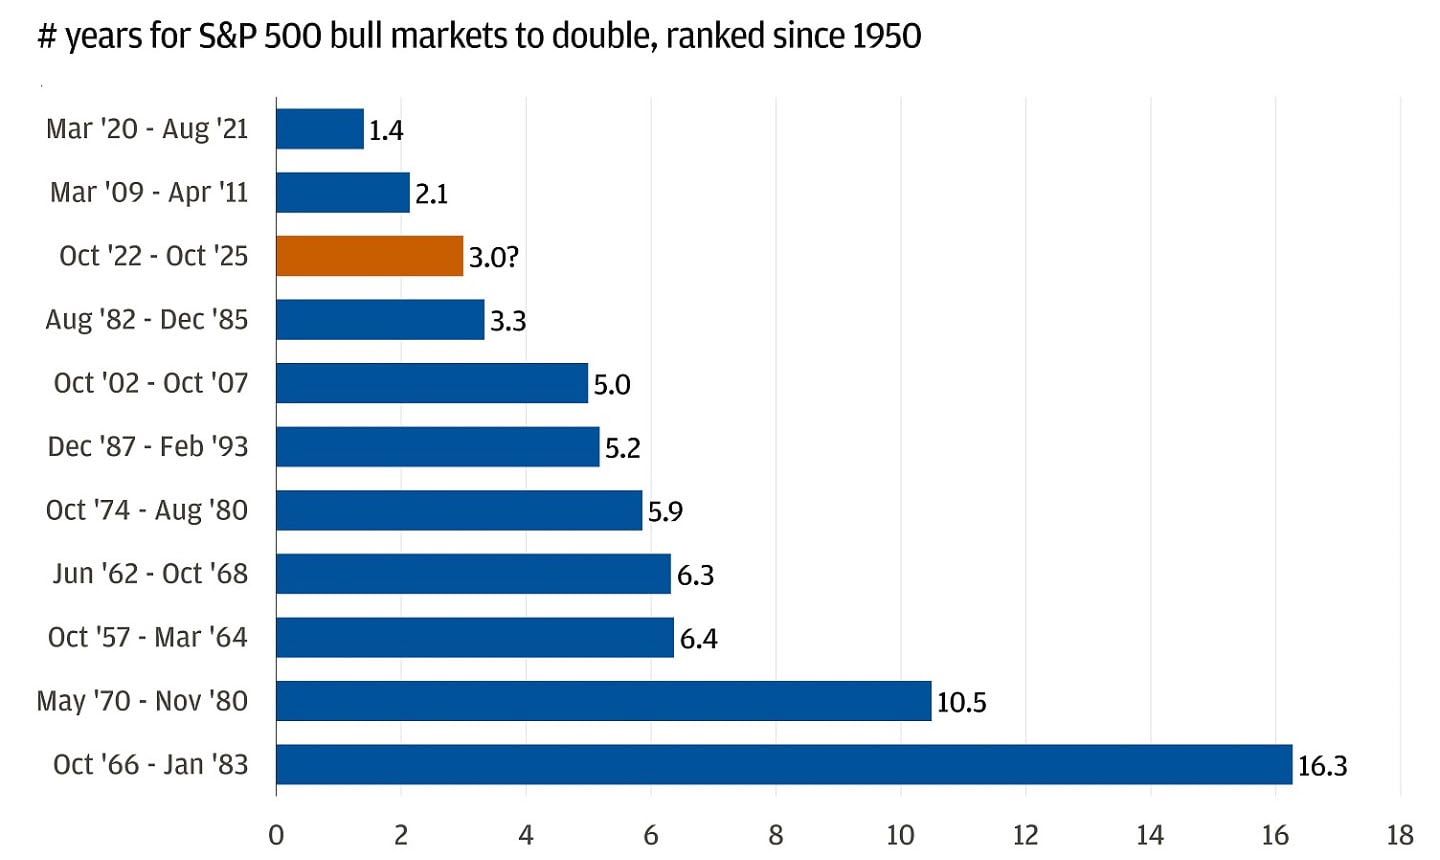
History suggests more upside: Postwar bull markets typically last five years, sometimes more. Momentum usually fades with a sharp policy shift or a recession – neither of which has arrived.
The rally has been strikingly calm: The S&P 500 hasn’t posted a single 2% pullback in 119 trading days. The CBOE Volatility Index (VIX), Wall Street’s fear gauge, has fallen back to historic lows. After a period of volatility, U.S. Treasury yields have stabilized. Instead of cracking under pressure, markets regained their footing – and didn’t look back.
“Sell America,” they said – but everything rallied anyway
Uncertainty initially sent the dollar, U.S. stocks and Treasuries tumbling – a rare trifecta many feared signaled the end of U.S. exceptionalism. But within weeks, a global “everything rally” took off.
The ‘everything rally’ – except cash
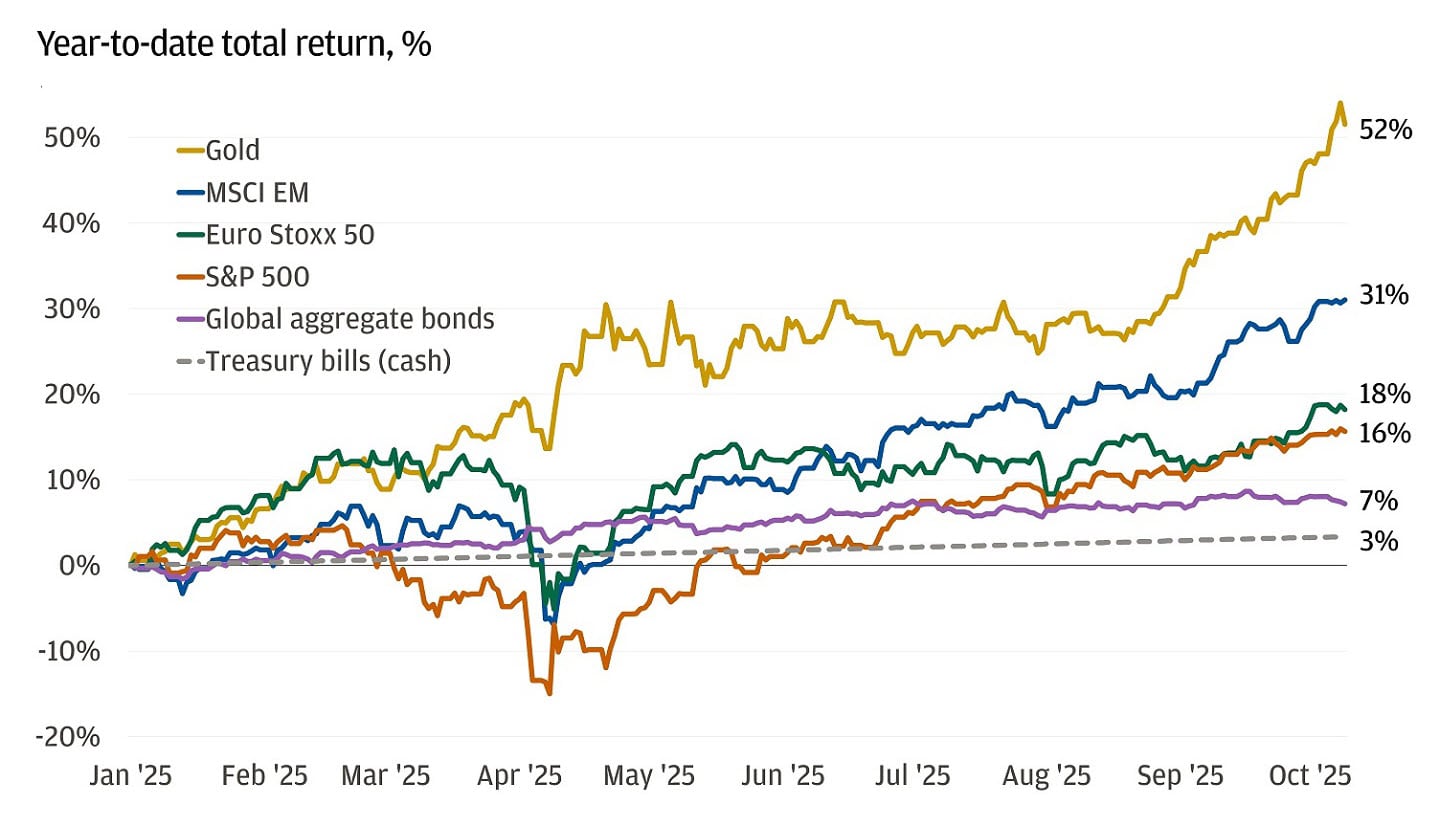
The S&P 500 is up about 15% this year – even after a 19% drawdown and full recovery – outpacing its historical annual average. U.S.-listed exchange-traded funds (ETFs) have pulled in $950 billion so far, including a record $150 billion in September., , Annual flows are on pace to top $1 trillion for the first time.
Momentum has gone global. European ETFs have raked in around $220 billion of inflows this year, and nearly 80% of the 60 global stock markets we track are up at least 10% the strongest breadth of its kind since 2009. Emerging markets are leading: Colombia (66%), Greece (66%), Peru (57%), Korea (57%) and South Africa (47%) are the year’s top five performers (in local currency).
Gold has also soared. It’s nearly doubled since early 2024, hitting a record $4,000 per ounce and on track to notch its eighth straight weekly gain.
It’s one of the broadest and strongest global rallies in over a decade.
What it means for investors
While tariffs haven’t delivered a clean reset of global trade, they’ve undeniably reshaped its dynamics – introducing new complexity and opening unexpected opportunities. And with President Trump’s latest threats, it’s clear this story is still unfolding.
But that’s been the story these past six months: Despite all the back-and-forth and headline risks, what stands out is rapid adaptation. Firms have restructured supply chains, embraced innovation and found new ways to navigate disruption. Markets have powered ahead, largely unfazed by political gridlock.
The takeaway isn’t certainty – it’s agility.
That’s why we’re focused on portfolio resilience: Being prepared for a range of outcomes in a world where the rules are still being rewritten.
All market and economic data as of 10/10/25 are sourced from Bloomberg Finance L.P. and FactSet unless otherwise stated.
You're invited to subscribe to our newsletters
We'll send you the latest market news, investing insights and more when you subscribe to our newsletters.
Global Investment Strategist