The next chapter: Diving deeper into the tariff saga

J.P. Morgan Wealth Management

Market Update
The trade policy saga continues. This week, a U.S. Court of International Trade ruled President Donald Trump’s sweeping "Liberation Day" tariffs illegal. However, within 24 hours, an Appeals Court temporarily paused that decision. Through it all, equities are heading higher as the short week closes.
This week the S&P 500 (+1.9%), Nasdaq 100 (+2.1%) and small caps (Solactive 200 +1.6%) all made solid advances. Within the U.S. large cap index, all 11 sectors are in the green, with the largest cohort, information technology (+2.8%), making the largest gain.
Internationally, equities also fared well. In Europe, the Stoxx 50 advanced 80 basis points and in Japan, the Tokyo Stock Price Index (TOPIX) increased by +2.8%.
In fixed income, yields – especially on the long end of the curve – have rallied. The 20 and 30-year yields are both lower about 10 basis points for the week, while the 10-year (4.42%) rallied about nine basis points.
Below, we delve deeper into the trade policy saga and highlight three opportunities we believe persist through the uncertainty.
Work with an advisor
Our advisors can provide ongoing financial advice on how your portfolio can adapt to the changes in the market, your life and your goals.
Spotlight
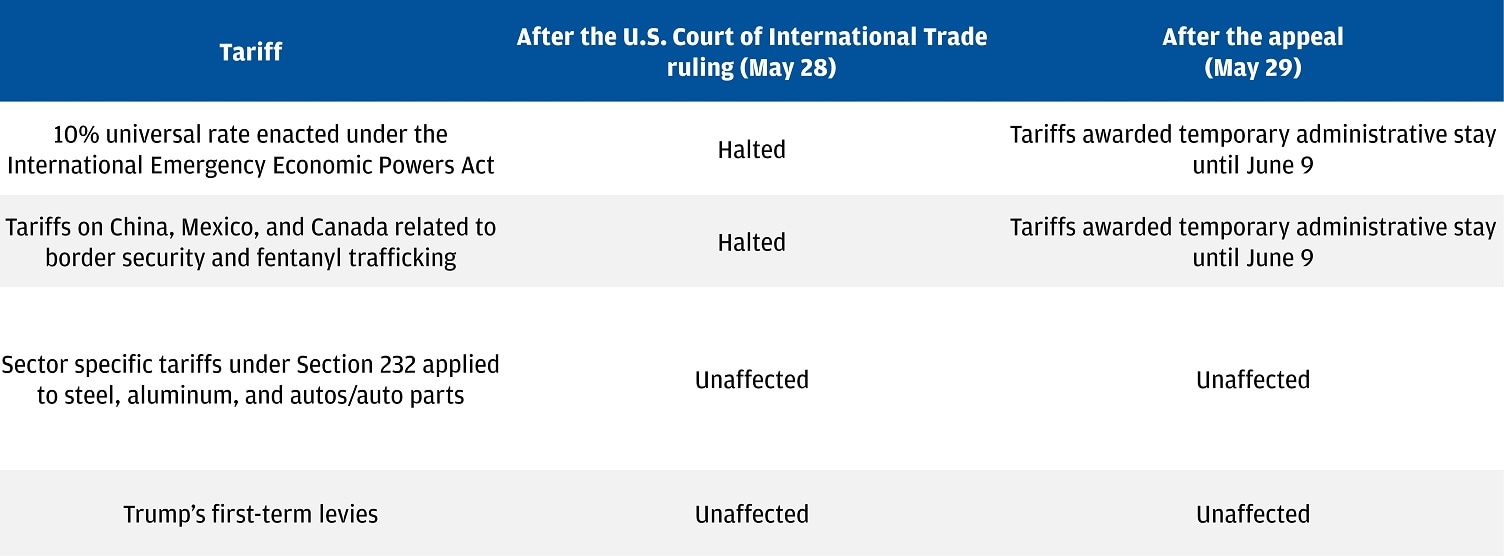
The latest in the tariff saga. As of Thursday evening, a federal appeals court has temporarily paused a ruling against President Donald Trump’s global tariffs while considering a longer-lasting hold on the decision. The appeal follows a Wednesday evening decision from the U.S. Court of International Trade, which blocked most of President Trump’s recent tariffs, ruling that the administration wrongly invoked the International Emergency Economic Powers Act (IEEPA).
What does that mean? In short, reciprocal tariffs are still in effect for now. But the first ruling, which declared the tariffs illegal, is a reminder that these tariffs are not codified into law by Congress and uncertainty remains.
The details: Congress has the authority to impose taxes and tariffs, but it did not pass a law for President Trump’s “Liberation Day” tariffs. These tariffs were enacted under the IEEPA, which allows the president to declare a national emergency and regulate imports. However, the U.S. Court unanimously ruled that the administration misused IEEPA, halting these tariffs, including a 10% universal rate and earlier tariffs on China, Mexico and Canada. The Justice Department argued that this decision interfered with government diplomacy and Trump’s authority in foreign affairs, requesting the Federal Circuit to pause the ruling while they appealed.
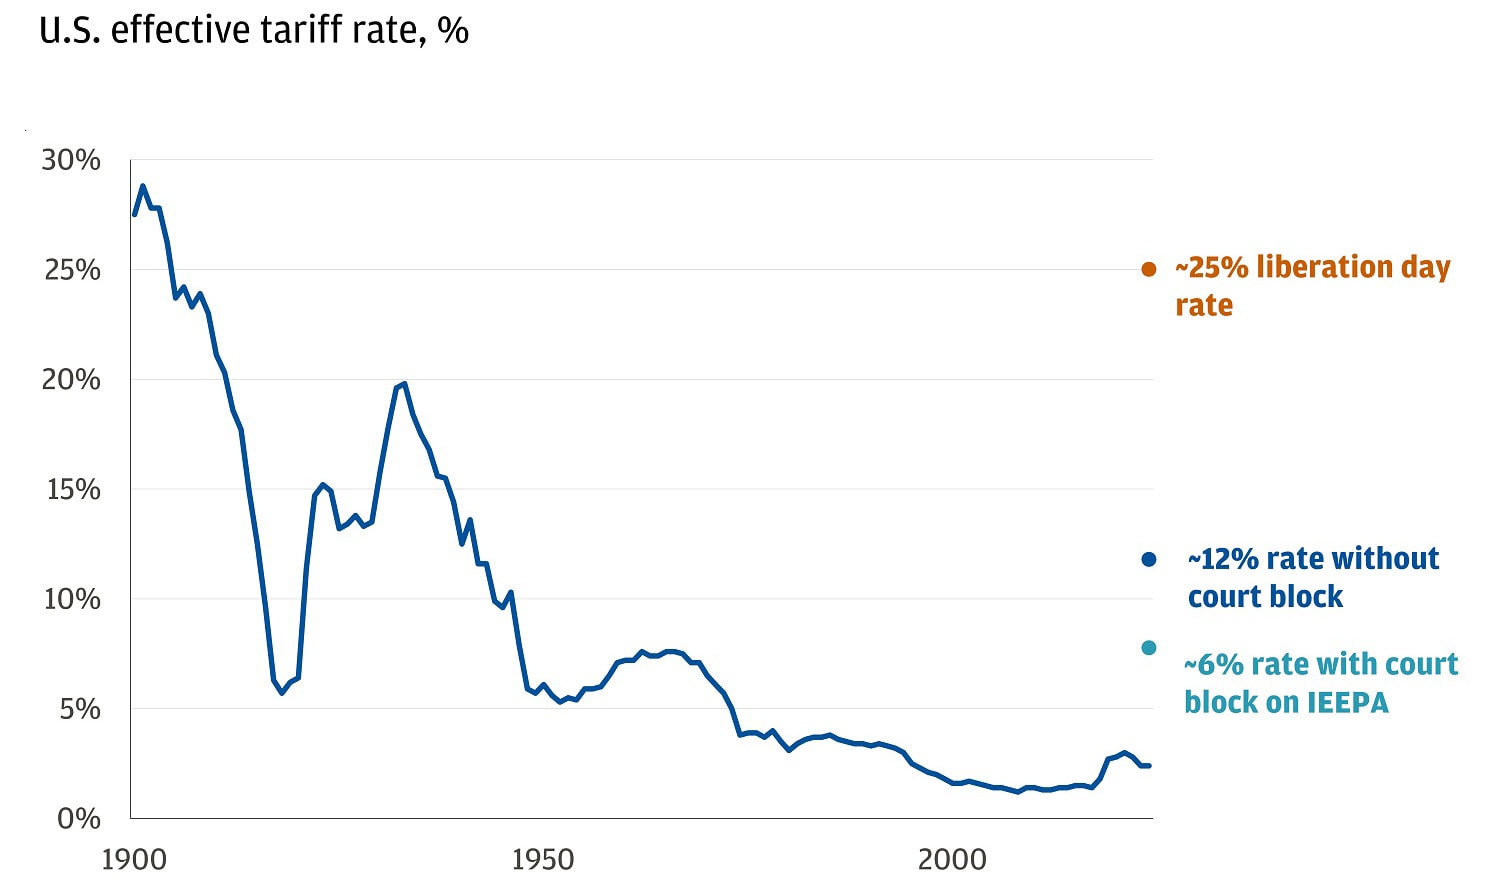
We estimated that the U.S. effective tariff rate might have decreased to around 5% to 7% had the appeal not been granted. Following the Appeals Court decision, that rate reverts closer to approximately 12%.
Estimated U.S. tariff rate
Importantly, we think the U.S. economy can handle either rate without falling into a recession. The immediate market response seems to agree and tariffs seem to be blending into becoming one of the many things driving markets, rather than the only thing, as was the case just a month ago.
What should portfolios do as a result? Instead of focusing on uncertainty, consider leveraging our high-conviction opportunities:
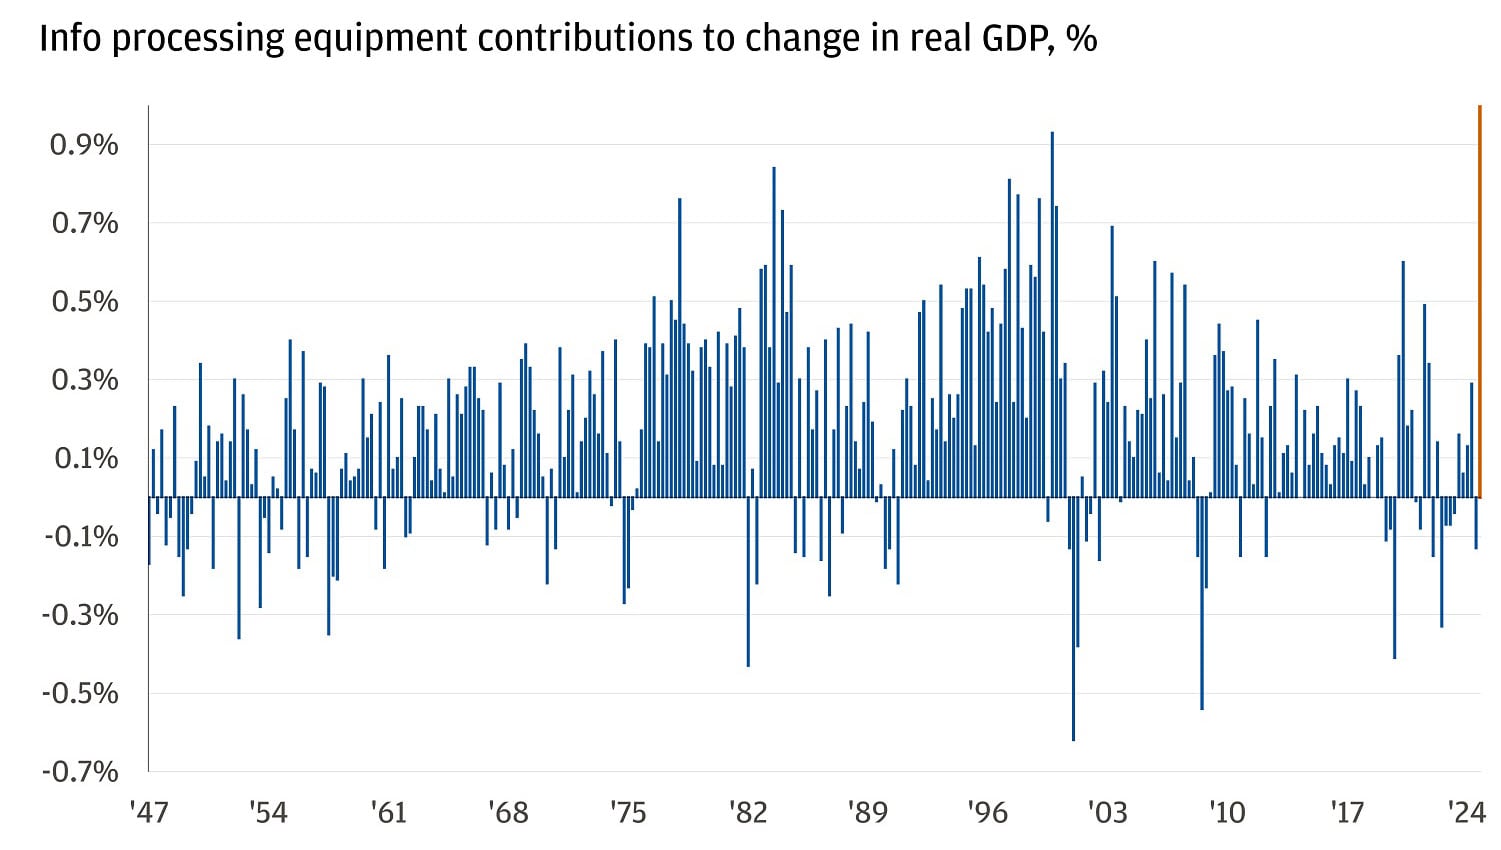
1. U.S. tech: Nvidia, the dominant player in advanced semiconductor chips, emphasized continued demand in the buildout of AI infrastructure in its earnings report earlier this week. According to CEO Jensen Huang, the AI build-out is ongoing, and “global demand for Nvidia’s AI infrastructure is incredibly strong. AI inference token generation has surged tenfold in just one year, and as AI agents become mainstream, the demand for AI computing will accelerate.” This was evidenced in the U.S. government’s first-quarter gross domestic product (GDP) report, which showed business investment in computers and other information processing equipment contributed a record 1.01 percentage points to first-quarter GDP – the highest on record.
Information processing equipment contributes a record amount to GDP
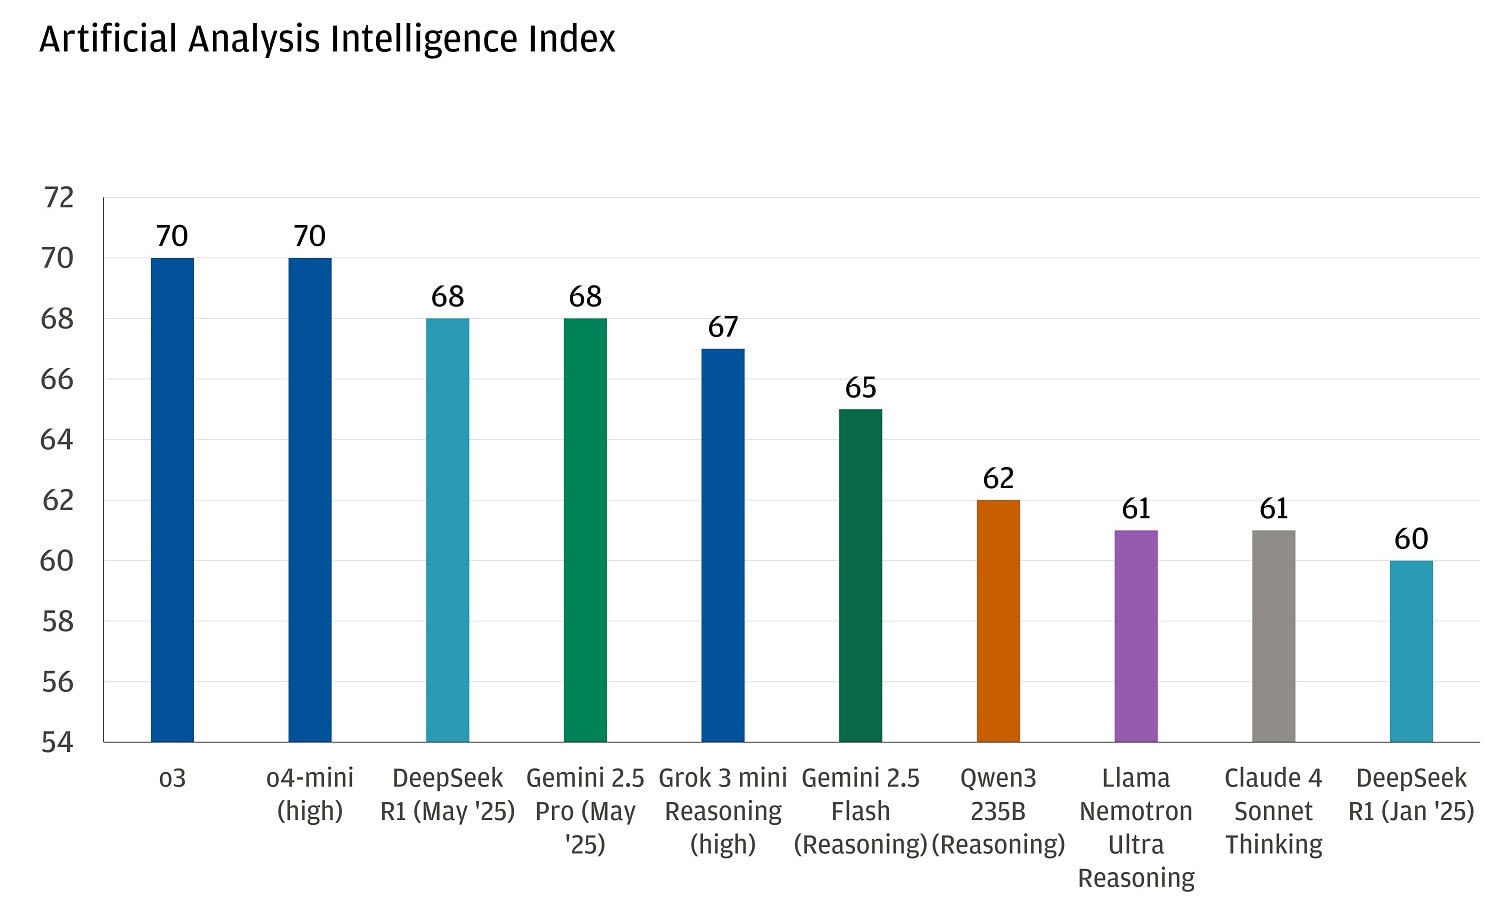
AI adoption is progressing in knowledge industries where expensive workers perform rules-based tasks. The industries using AI the most are also those with the highest free cash flow margins, which may indicate that in the early stages of adoption, AI may enhance margins rather than diminish them. Despite concerns about U.S. exceptionalism, the U.S. remains a leader in AI innovation, with U.S. companies holding four of the top five spots in the AI intelligence index, meaning that an investment in the AI theme remains an investment in U.S. tech.
The U.S. remains an AI innovation leader
2. U.S. financials: The U.S. financial system is one of the most strictly regulated sectors in the market. This seems to be for good reason, since following the 2008 financial crisis, there was a significant push for increased regulation primarily through Dodd-Frank aimed at preventing a recurrence of the crisis. However, in recent years, there has been debate that the U.S. financial system, in particular, has moved towards overregulation or regulation that doesn’t prevent bank crises (stringent capital requirements didn’t prevent Silicon Valley Bank’s collapse in 2023.)
As a result, it has been well telegraphed by the administration that deregulation, specifically lowering the Supplementary Leverage Ratio in the financial sector, is on the agenda. The Supplementary Leverage Ratio (SLR) is a leverage requirement for banks, ensuring they hold a minimum amount of equity, preferreds and debt relative to their total assets. It treats all assets equally, regardless of risk. There are discussions about excluding cash or treasuries from assets in the denominator to improve liquidity in the treasury market. This exclusion could specifically lead to a surplus in debt and preferreds. If banks bring down this surplus through lower debt or preferreds, it could be positive for existing securities. Within equities, deregulation could also reduce compliance costs and encourage mergers and acquisitions, leading to higher earnings and valuations.
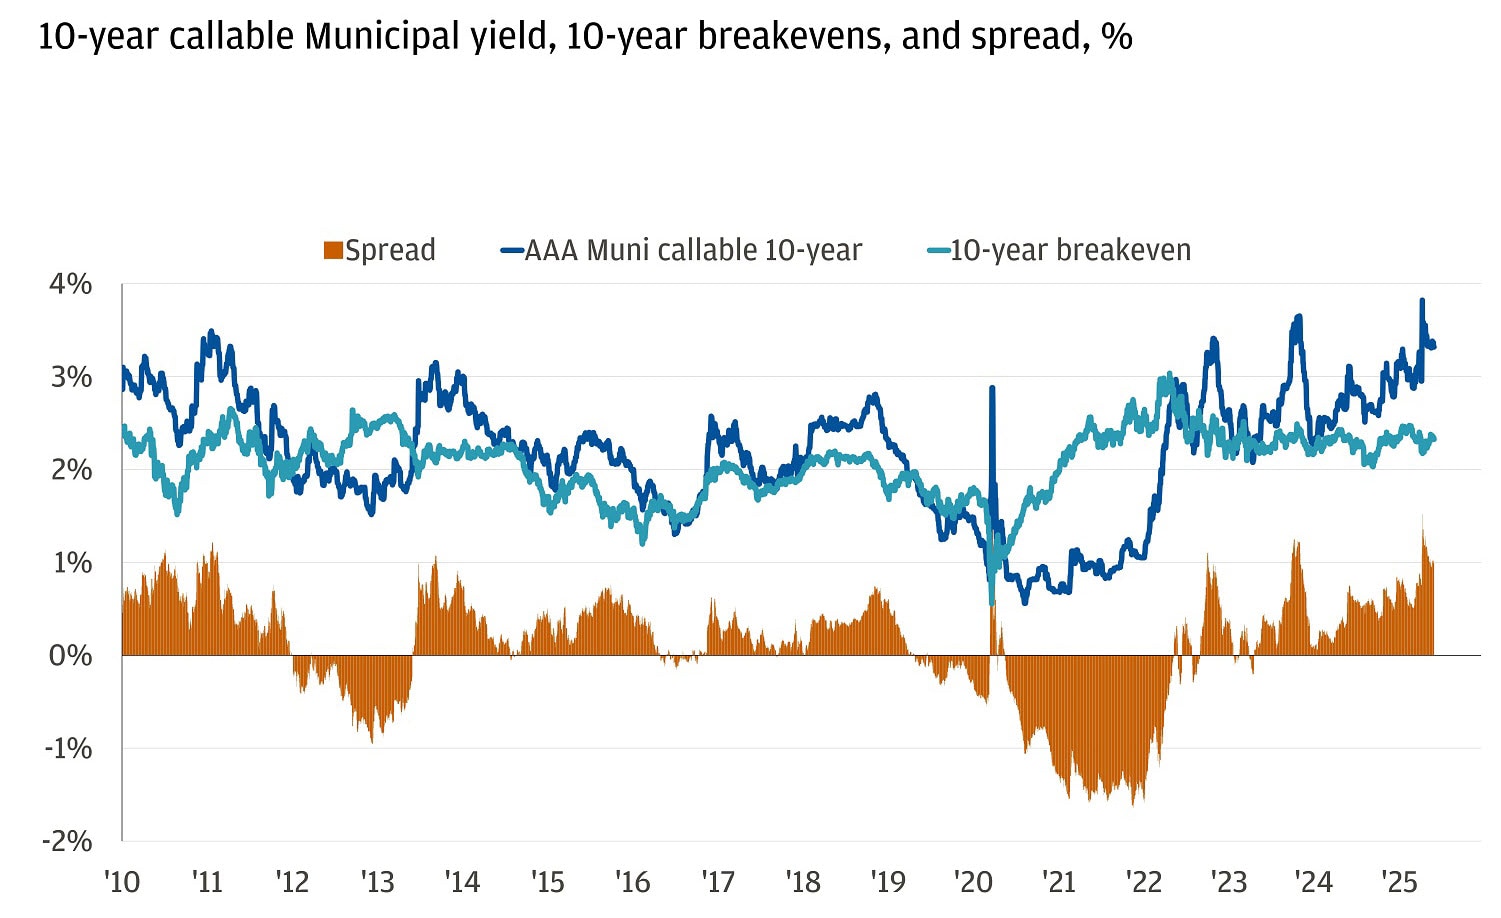
3. Municipal bonds: Risks to the growth picture remain, especially if tariff roundabouts are achieved. Our preferred way to hedge portfolios against these risks are through municipal bonds. The inflation-adjusted yield in munis stands out as particularly compelling. The chart below shows the yield for the 10-year AAA callable municipal bond index and the 10-year breakeven rate (a market measure of inflation over the next 10 years). The orange bars represent the spread between the two and currently, that spread (or compensation above inflation expectations) is in the 97th percentile since 2010, meaning your estimated “real yield” on a 10-year muni is at one of the highest levels in a decade and a half.
10-year Municipal real yield in 97th percentile
For questions on how these opportunities can fit into your portfolio, reach out to your J.P. Morgan advisor.
All market and economic data as of 05/30/25 are sourced from Bloomberg Finance L.P. and FactSet unless otherwise stated.
Explore ways to invest
Take control of your finances with $0 commission online trades, intuitive investing tools and a range of advisor services.
J.P. Morgan Wealth Management