Threading the needle: Where markets may be mispricing trade risk

By: Jake Manoukian, Sitara Sundar, Alan Wynne
Market update
U.S. equity markets are heading towards their second-strongest weekly finish of 2025.
The S&P 500 (+3.8%), Nasdaq 100 (+5.2%) and small caps (Solactive 2000 +4.1%) are all heading higher. Globally, European (+3.6%), Japanese (+2.5%) and Chinese onshore (+2.4%) equities also made significant gains. Much of the market momentum seems linked to positive talks on trade and a possibility of the U.S. lowering tariff rates on China (more below).
Bond yields are heading towards a flat finish for the week, while gold (–0.9%) and oil (–2.9%) both finished lower.
The story moving markets this week was a Wall Street Journal report that the U.S. is considering extending an olive branch in the form of a trade deal with China. The report states that the Donald Trump administration is considering reducing tariffs on Chinese imports, potentially by more than half, to ease tensions with Beijing that have affected global trade and investment. President Trump indicated that any tariff decisions will come directly from him, and that China was open to dialogue.
Later in the day, Treasury Secretary Scott Bessent pulled back the olive branch slightly and clarified that President Trump has not offered to unilaterally reduce U.S. tariffs on China. Bessent emphasized that neither side views the current tariff levels as sustainable, suggesting that a mutual reduction might occur. He noted that the strongest ties between Washington and Beijing are at the leadership level – with no set timeline for engagement – and that a full trade rebalancing could take two to three years.
However, China’s Commerce Ministry spokesman He Yadong stated “any reports on development in talks are groundless” and that the U.S. needs to show “sincerity” if it wants to make a deal.
These developments further tangle the complex geopolitical thread that has been spinning since April 2. We (and the rest of Wall Street) don’t have an edge in determining what trade deals will be made or when. But considering the persistent tension between the world’s two largest economies, we present two opportunities below where we identify mispricings that could mean value for investor portfolios.
Work with an advisor
Our advisors can provide ongoing financial advice on how your portfolio can adapt to the changes in the market, your life and your goals.
Spotlight
1. Domestically focused European corporations: As tariff uncertainty grows, markets that are relatively immune become more attractive. Close to 50% of European equity revenue comes from within the region, meaning that those revenues are relatively more insulated against fluctuations in external trade.
Domestic exposure in Europe close to 50%
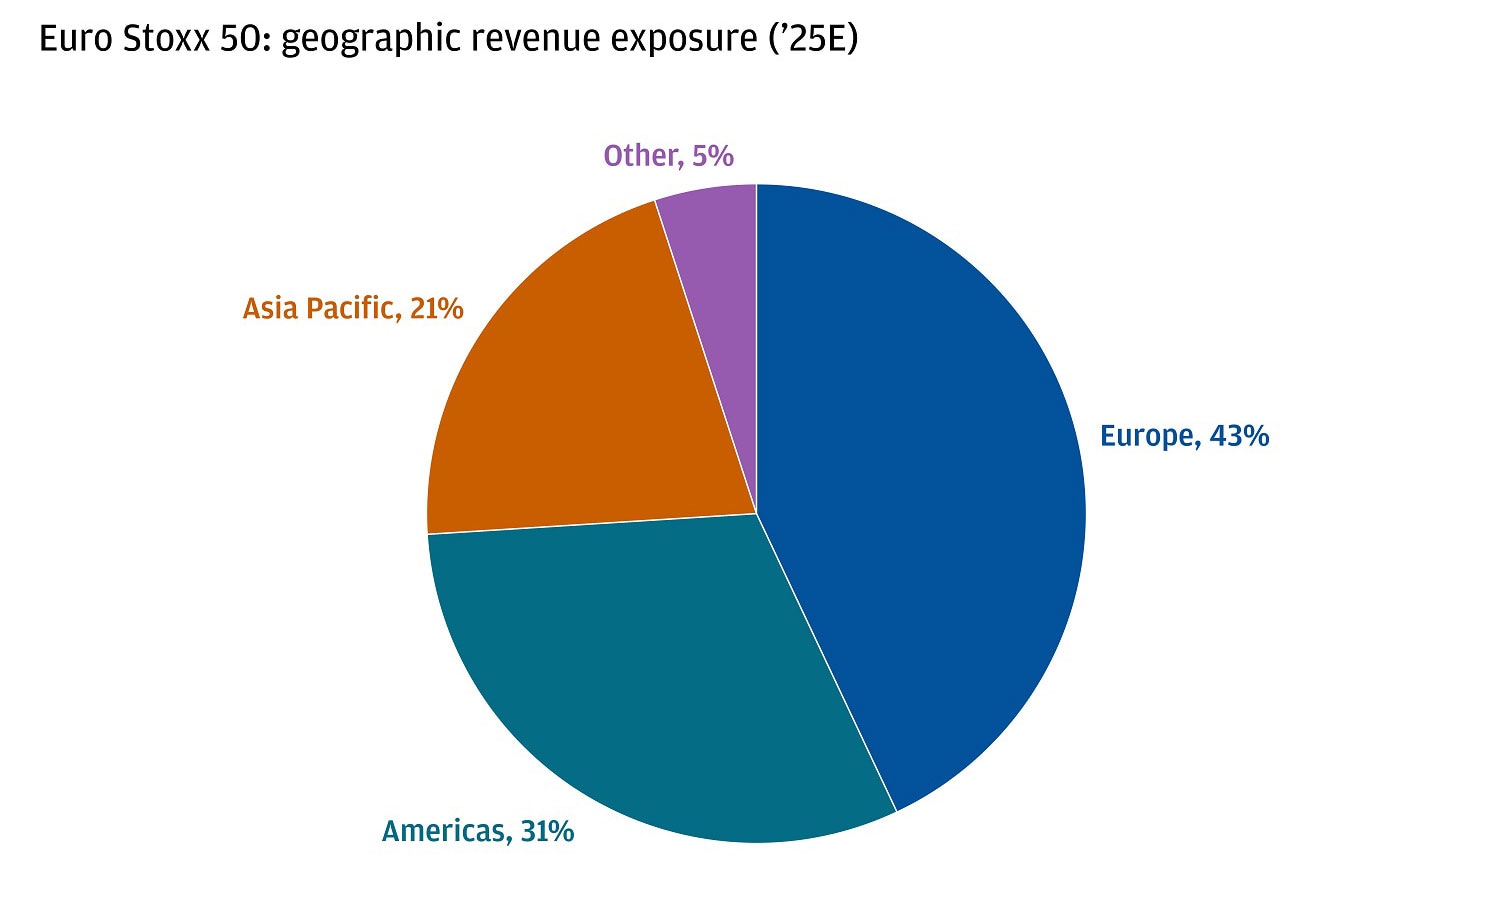
The revenues sourced within the region become more important when you consider that for the first time in a long time, Europe is becoming a domestic growth story. Germany’s 500-billion-euro fiscal stimulus package is significant, exceeding 1% of gross domestic product (GDP). For perspective, that’s larger than the U.S. fiscal response amid the COVID-19 pandemic on a relative GDP basis. Our estimates suggest that the package could lead to an annualized GDP increase of 0.6% to 0.8% for Germany over the next three years, spilling over to the European region and boosting growth by 0.4% to 0.5% per year during that period.
We think the boost to growth could lead to sustainably higher multiples for European equities towards 14.5x forward earnings from roughly 14x now, which would still represent a close to 30% discount relative to current U.S. valuations. What’s more, as we focus on increasing income in portfolios, European equities offer a dividend yield around 200 basis points above the S&P 500.
The kicker comes in the form of a historically ignored factor for U.S. investors: foreign exchange return. While we do not foresee the dollar losing its reserve currency status soon (nearly 90% of all Forex trades involve the U.S. dollar), capital will likely continue its shift at the margin out of dollars and into other global markets amid downside USD risks. While the Euro Stoxx 50 has returned about 4.5% year-to-date in local currency terms, the euro’s appreciation against the dollar has led to gains in the mid-double digits for unhedged dollar-based investors.
2. Municipal bonds for tax sensitive U.S. buyers. The Bloomberg Municipal AAA yield curve has steepened significantly, with the 30-year yield increasing close to 70 basis points year-to-date, reaching levels not seen since the global financial crisis. This steepening, along with the absolute yield on the Bloomberg Municipal bond index, presents a compelling investment case.
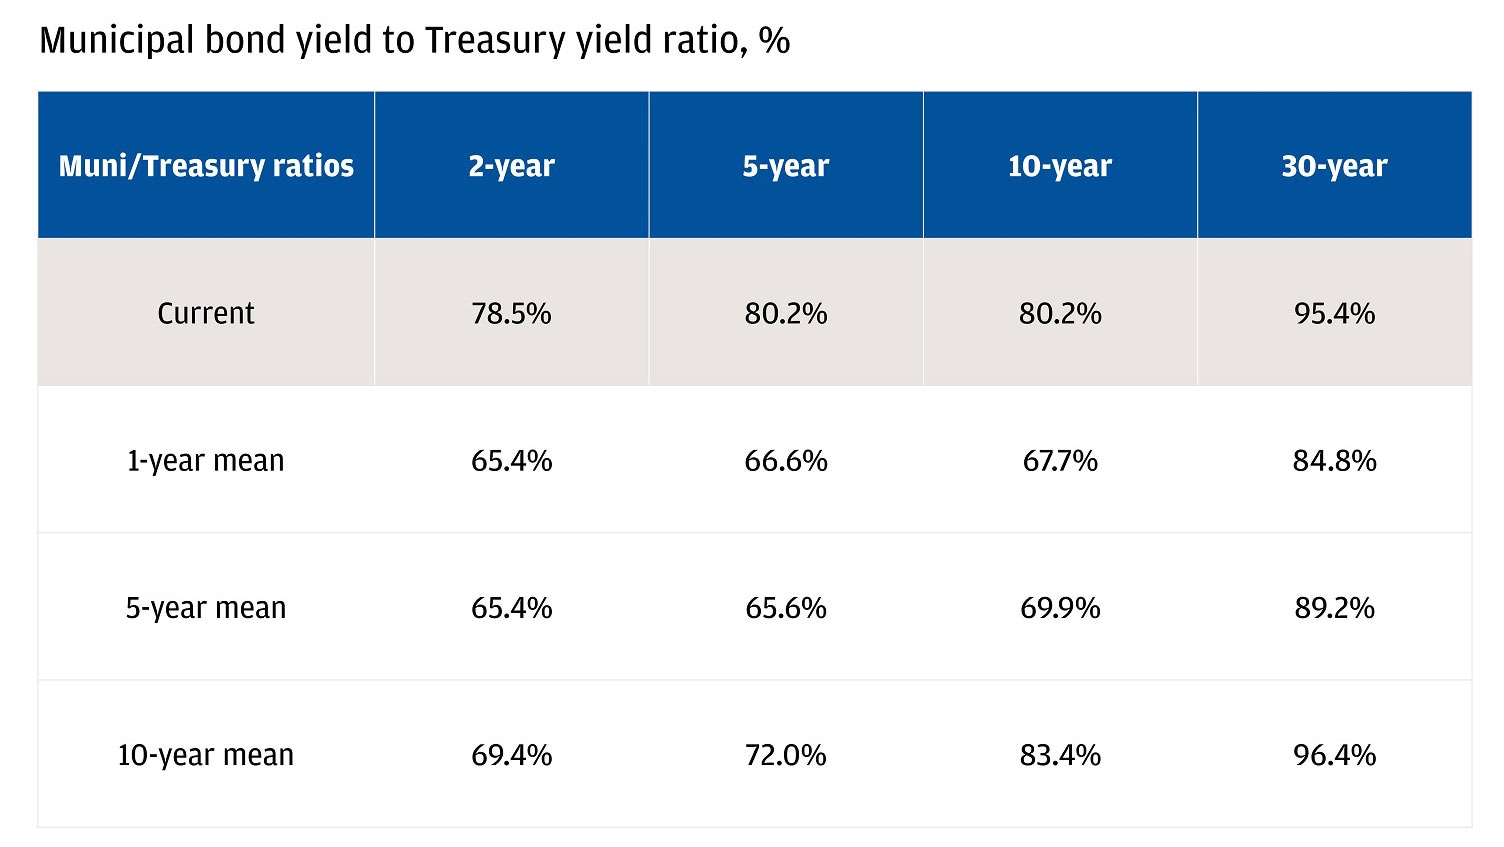
It’s not just the absolute yield but also the relative yield versus Treasuries (Muni bond yield / Treasury yield of similar tenor, where a higher ratio is better for munis) that stands out as attractive. Both the 2 and 5-year parts of the curve are trading cheaply on 1, 5 and 10-year averages, while the 10 and 30-year parts are attractive relative to 1 and 5-year averages.
Current municipal bond ratios are favorable relative to history
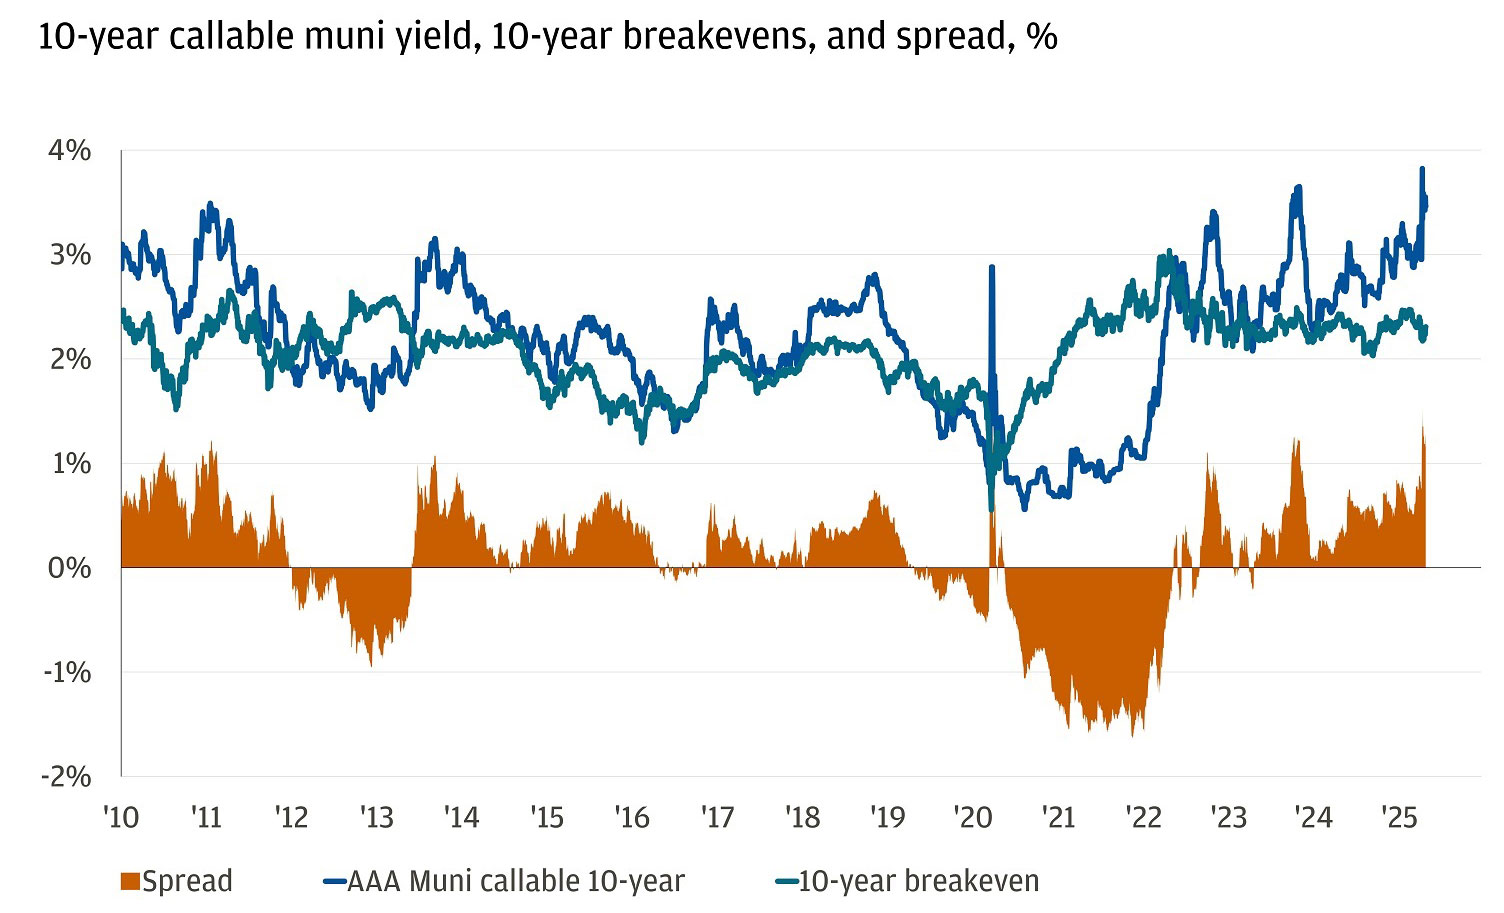
Lastly, the inflation-adjusted yield in munis stands out as particularly compelling. The chart below shows the yield for the 10-year AAA callable municipal bond index and the 10-year break-even rate (a market measure of inflation over the next 10 years). The orange bars represent the spread between the two and currently, that spread (or compensation above inflation expectations) is in the 99th percentile since 2010, meaning your estimated “real yield” on a 10-year muni is at one of the highest levels in a decade and a half.
10-year muni real yield in 99th percentile
What’s driving the cheapening in municipal bonds is market concerns over their tax-exempt status.
Municipal bonds are debt securities issued by states, cities or other local government entities to fund public projects. The interest income from these bonds is typically exempt from federal income tax (the federal government doesn’t tax municipalities and vice versa). This tax exemption makes municipal bonds attractive for individuals in higher tax brackets.
The U.S. government is seeking ways to limit its deficit while passing an extension of the Tax Cuts and Jobs Act (TCJA). The House of Representatives voted to adopt the Senate-amended Fiscal Year (FY) 2025 concurrent budget resolution, allowing for legislation to add $5.8 trillion to deficits through FY 2034. Some chatter in Washington has floated taxing municipal bond interest to raise government revenues. Given that the government only misses out on roughly $30 billion per year in revenue by not taxing muni bonds, changing that policy wouldn’t make a dent. Our base case remains that municipal bond interest will remain exempt from federal taxes and can continue to be a ballast and diversifier in portfolios.
For more details on how these options may fit in your portfolio, reach out to your J.P. Morgan advisor.
All market and economic data as of 04/25/25 are sourced from Bloomberg Finance L.P. and FactSet unless otherwise stated.
Explore ways to invest
Take control of your finances with $0 commission online trades, intuitive investing tools and a range of advisor services.