Where will tariff rates settle? 3 scenarios explained

J.P. Morgan Wealth Management

Market update
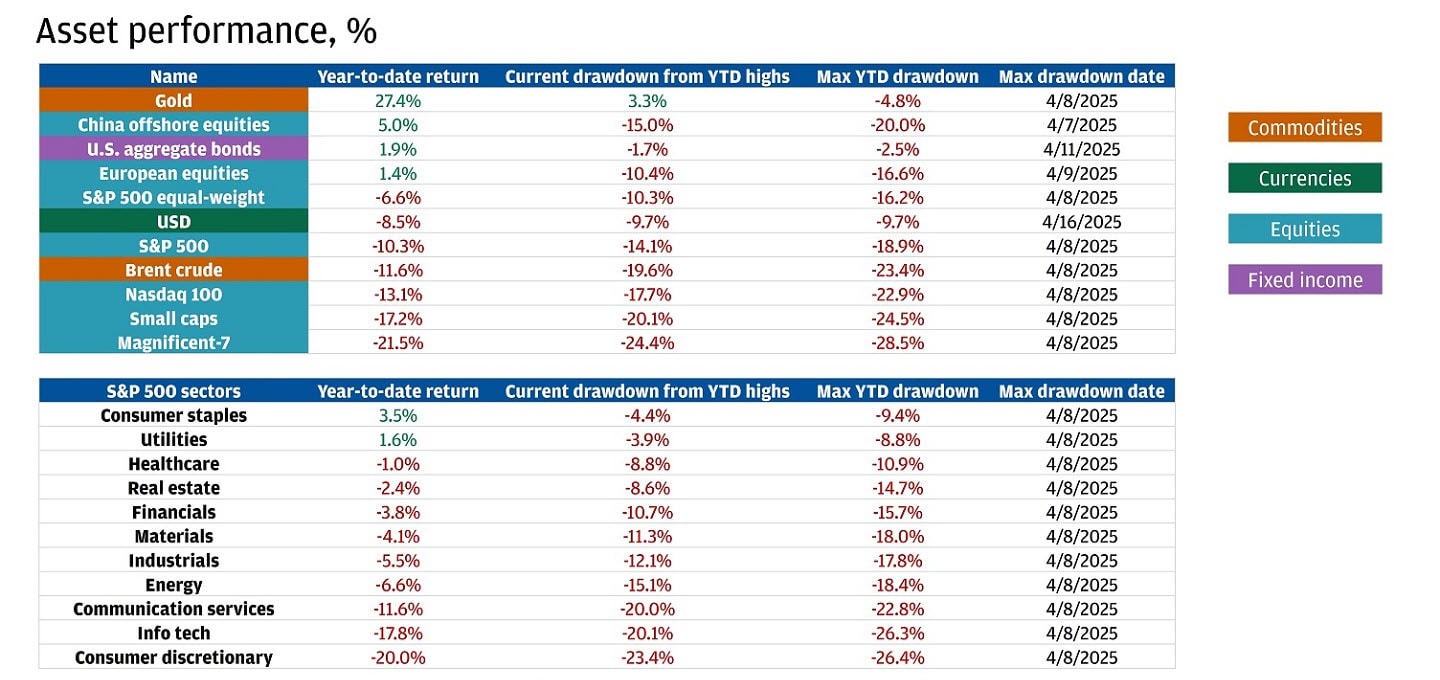
U.S. large-cap stocks couldn’t maintain last week’s momentum.
Heading towards this week’s close, the S&P 500 (-1.6%) and Nasdaq-100 (-2.3%) fell during the shortened trading week. The relief investors felt last week from a delay in consumer and industrial electronics tariffs was short-lived, as those delays were confirmed temporary this week.
Also weighing on investor sentiment was Federal Reserve Chair Jerome Powell’s Wednesday speech, which delivered a slightly more hawkish tone. It may indicate that the central bank is unwilling to change its policy rate given current economic conditions, despite pressure from the administration.
Globally, European (+3.1%) and Chinese offshore (+0.7%) equities continue to perform well, possibly due to a shift away from U.S.-dollar-denominated assets amid uncertainty.
In commodities, gold (+3.6%) continues to shine. The precious metal passed $3,350 for the first time ever this week and is up nearly 30% this year. As investors, including central banks, continue to consider diversifying away from Treasuries amid heightened uncertainty, gold has been the main beneficiary.
As tariffs continue to dominate headlines, including “big” progress with Japan and little progress with Europe this week, and market swings, we break down three tariff scenarios and what they could mean for your portfolio.
Spotlight
We believe changes in the U.S. effective tariff rate and its impact on global trade drive market volatility. This is why the chart below, championed by our Chairman of Asset and Wealth Management Investment Strategy Michael Cembalest, is crucial for Wall Street strategists this year.
Estimated tariff rates have declined
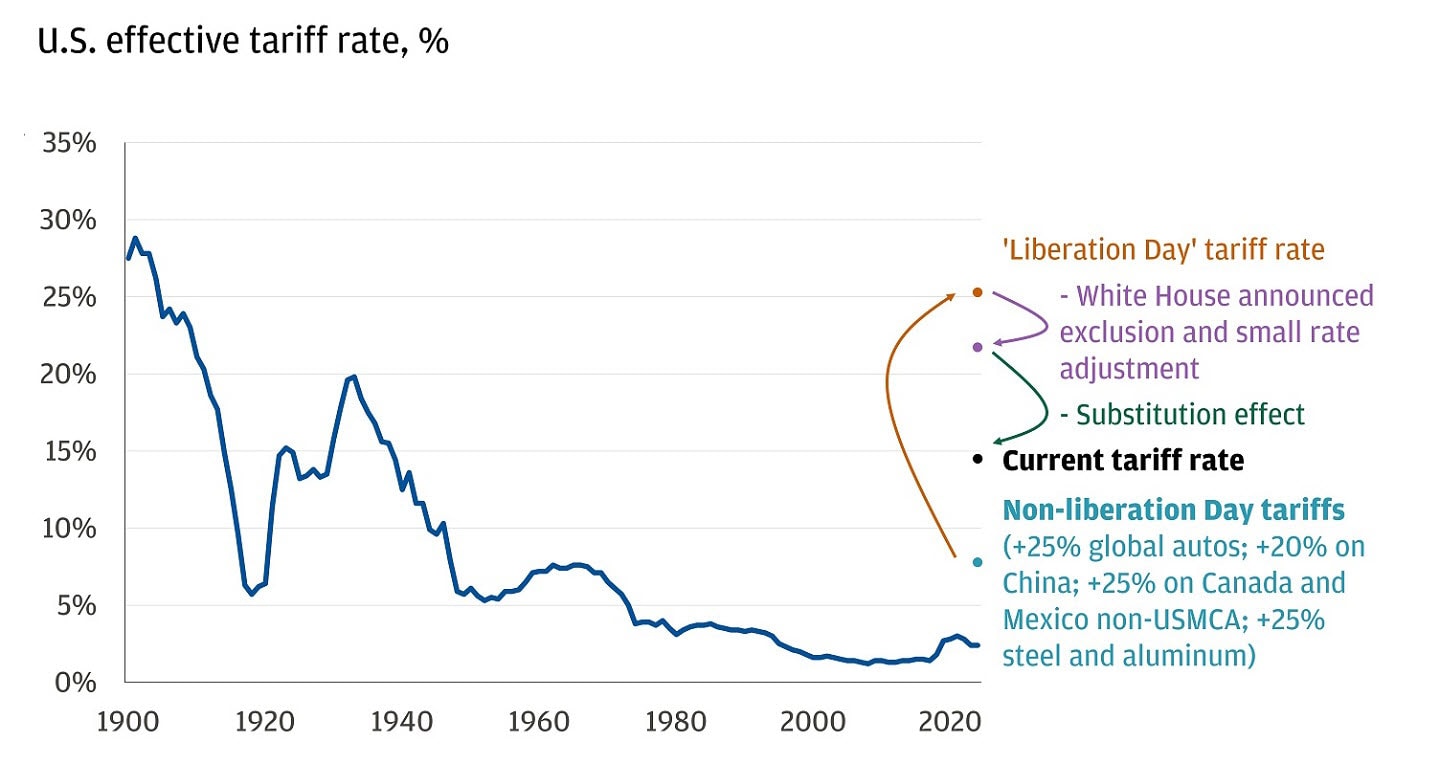
Tariff announcements, retaliations, and delays have created a fluid environment, to say the least, impacting the chart above multiple times. In such markets, we think it’s prudent to remain humble and acknowledge that the tariff rate can remain fluid, influenced by unpredictable factors like policy shifts, potential exclusions or deals or substitution effects. No one can predict the final rate exactly. Nonetheless, we provide three tariff scenarios below and how we expect markets to perform in each.
Work with an advisor
Our advisors can provide ongoing financial advice on how your portfolio can adapt to the changes in the market, your life and your goals.
Scenario 1 (our highest conviction case): We assume some deals are struck between the U.S. and its trading partners, and substitution effects dampen some statutory tariff rates. We think the effective tariff rate ultimately lands in the range of approximately 10-20%. Note that we started the year at an approximately 2% effective tariff rate, so this still represents a meaningful increase in import duties but lands within Wall Street estimates pre-”Liberation Day.”
This scenario would still likely result in a meaningful hit to U.S. growth, higher unemployment and inflation. However, we believe the U.S. economy would avoid a recession, albeit narrowly. Market volatility would likely continue, and tariffs would hurt earnings. Monetizing volatility here can benefit portfolios.
To accomplish this, investors who qualify could consider structured notes in diversified portfolios. Structures can provide defensive equity exposure with a focus on delivering income through options premiums – these strategies can effectively monetize volatility to provide income while sacrificing a portion of the upside.
Scenario 2: Full tariff implementation and partial retaliation from trade partners. In our view, this is the worst-case scenario for markets. If the April 9 reciprocal tariffs are durable and fully implemented, we expect the U.S. effective tariff rate to exceed 20%.
In this scenario, the increase in tariffs could result in higher prices, reduced consumer spending, stifled business confidence, delayed investments, economic demand destruction, job losses and ultimately a U.S. and global recession. Investors would be best positioned defensively.
We’d expect both the Fed and the European Central Bank to cut rates meaningfully, bond yields to fall, global stocks to tumble double-digits and the U.S. dollar to continue weakening. In that scenario, allocations to fixed income and gold can benefit investor portfolios. Core bonds can offer stability and income, providing a safe haven for investors seeking to preserve capital amid market uncertainty. Particularly for U.S. investors, municipal bonds trading at favorable valuations relative to history can add tax-advantaged income.
Current municipal bond ratios are favorable relative to history
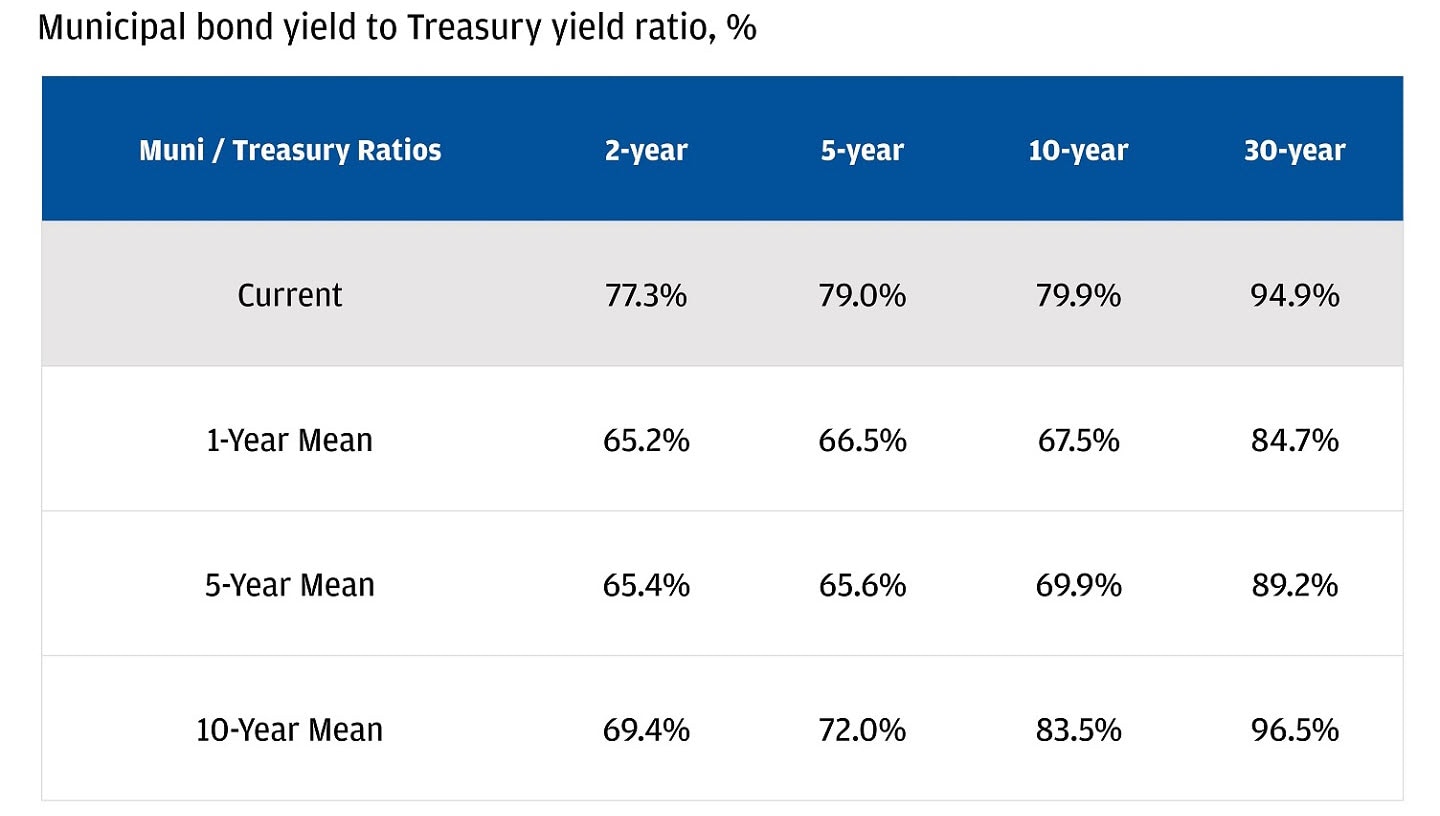
Municipals are especially timely as it’s been reported that the White House is floating a proposal within the House GOP to raise the tax rate for people making more than $1 million to 40% to offset the cost of eliminating tax on tips and Social Security. An increase in the top tax rate would be a tailwind for municipal bond demand.
Additionally, gold has returned +27% year-to-date amid volatility. The metal has proven its worth as a geopolitical hedge, and as central banks continue to diversify reserve holdings away from U.S. Treasuries, it could have room to rise further.
Scenario 3: A positive resolution with tariffs delayed or not as economically onerous as feared, allowing the administration to regain market confidence. In this scenario, we expect the U.S. effective tariff rate to fall to less than 10%.
We think this scenario is least likely but most positive for risk assets. It has the most potential upside for global stocks, with returns potentially exceeding 20%. Central banks may still cut rates a few times, while bond yields remain range-bound, and the dollar reverses some recent losses. Risk assets that suffered most during the tariff trade are likely beneficiaries (e.g., mega-cap tech, small caps, and energy, etc.).
U.S. equities, USD, and oil lagging
The situation remains fluid, and any of these scenarios could come to fruition. As such, our investment advice emphasizes strategies to help investors manage volatility and diversify portfolios. This includes expanding global asset and currency exposure and incorporating uncorrelated assets like gold for eligible investors. In a significant market downturn, core fixed income can offer resilience to multi-asset portfolios. For investors who qualify, equity-linked structured notes may provide downside hedging while maintaining attractive return potential.
For questions on best positioning your portfolio, your J.P. Morgan team is here to help.
All market and economic data as of 04/17/25 are sourced from Bloomberg Finance L.P. and FactSet unless otherwise stated.
Explore ways to invest
Take control of your finances with $0 commission online trades, intuitive investing tools and a range of advisor services.
J.P. Morgan Wealth Management