What is a candlestick pattern? How this charting technique works

- A candlestick pattern is a charting technique that was first introduced to the U.S. in the early 1990s, but it got its start in the 18th-century Japanese analysis of rice prices.
- Candlestick patterns show more information about the trading activity on a security than simple closing prices.
- Some of the colorful names that distinguish candlestick patterns include the “Three Black Crows,” the “Hanging Man,” the “Morning Star” and the “Three White Soldiers.”

Candlestick patterns are one way to represent the price of a stock (or any other security) on a chart. They are called “candlesticks” because they are thick rectangles with lines at the top and the bottom that look like the wicks of candles.
Traders use candlestick patterns to create trading strategies. Because candlesticks are a representation of daily price moves, most strategies based on this method are used primarily for day trading.
Candlestick patterns explained
Candlestick charts were introduced to traders in the U.S. in the 1990s by Steve Nison, author of the book “Japanese Candlestick Charting Technique,” who originally adapted the concept from a technique developed by rice traders in Japan in the 1700s. The form of the candlestick gives traders more information about a stock price than simply where it stood at the close of the market on a particular day. Nison also introduced his readers to the evocative names Japanese traders used to describe these patterns, such as the “Bullish Engulfing,” the “Morning Star,” “Three White Soldiers,” “White Marubozu” and the “Bullish Harami.”
In addition to the signature shape of the candlestick bars, the chart is typically also color-coded, whether in black and white or in complementary colors. The essential elements of a candlestick chart include the following:
- Each day represents one candlestick.
- The range between the top and the bottom of the candlestick bar denotes the open and close prices of the security.
- The highest and lowest recorded prices above and below the open and close prices are the wicks, which are also called shadows. From the top of the top wick to the bottom of the bottom wick is the total price volatility of the day.
- If the price closes higher than it opens, the body of the candle is “unfilled”; in the case below, it’s color-coded green.
- If the price closes lower than it opens, the body of the candle is “filled”; in the case below, it’s color-coded red.
Candlestick pattern of the S&P 500 Index
Below you can see a candlestick pattern charting technique applied to the S&P 500 Index for a six-month period (for illustrative purposes only). Each day is represented by one candlestick. The green candlesticks are days when the index closed higher than it opened, while the red ones are days when the price closed lower than it opened. Within this chart, you can see several candlestick patterns that may be used by traders to better understand buyer and seller activity on a given day. When the candlestick is green, buyers benefitted most that day. When the candlestick is red, sellers benefitted most that day.
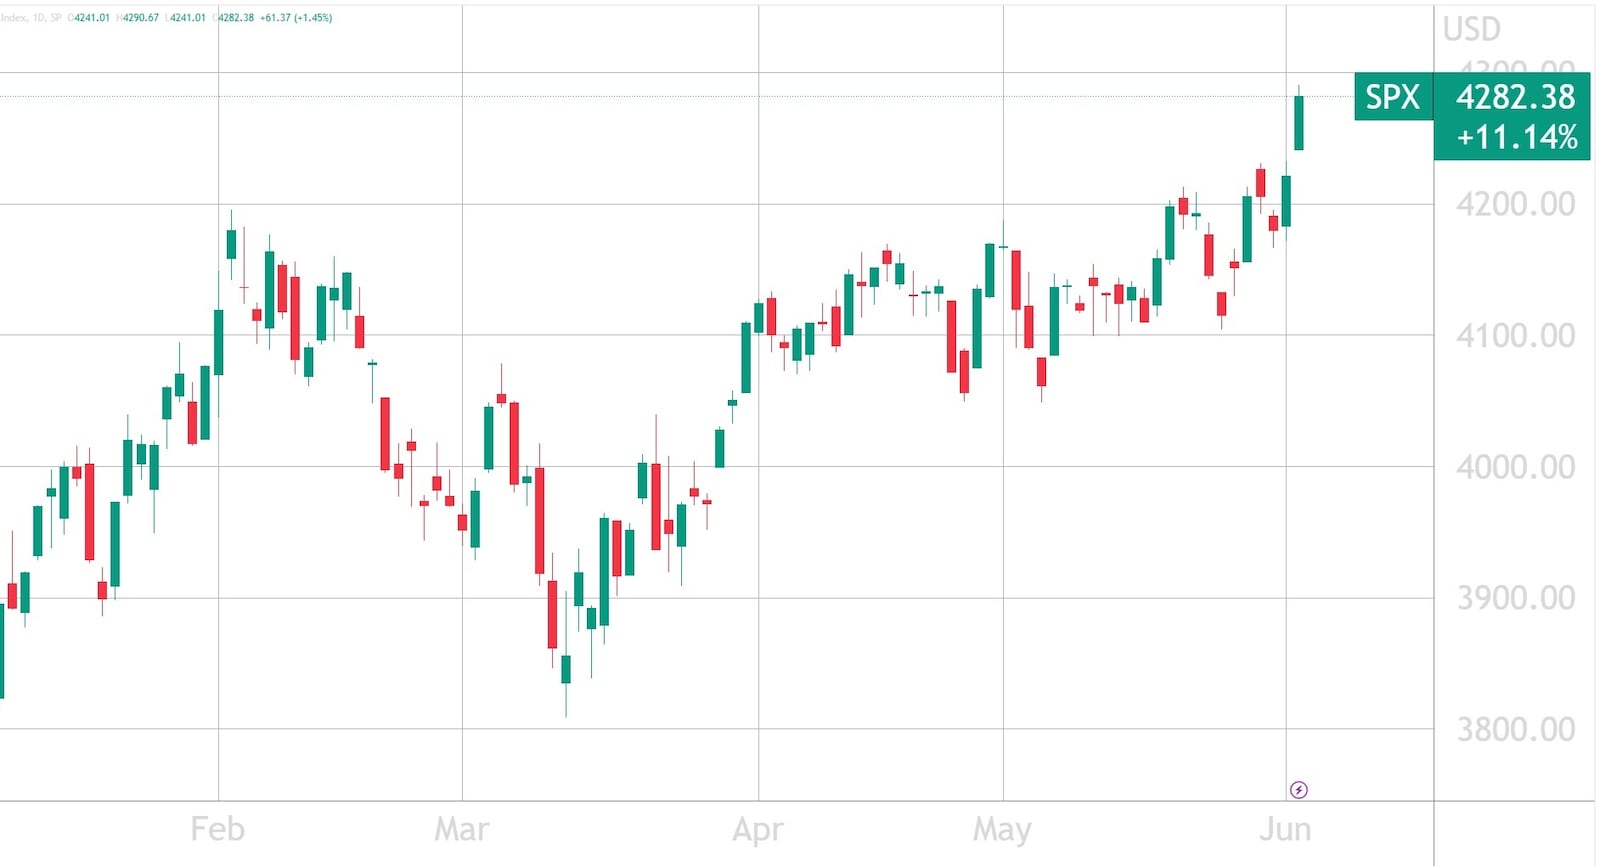
This visual representation above provides traders with much more information about how buyers and sellers impact prices throughout the trading day. Emerging patterns that traders have named and classified may also show where a price is headed in the short term.
Get up to $1,000
When you open a J.P. Morgan Self-Directed Investing account, you get a trading experience that puts you in control and up to $1,000 in cash bonus.
The most common candlestick patterns
The most common candlestick patterns are divided into “bullish” and “bearish” types. These patterns show price movements that will likely lead to a more significant movement either up or down. For example, some patterns can show that three days of moderate price losses will likely lead to a much more significant gap down, or that three days of price losses consolidating a bearish position will likely lead to a significant gap up.
Other common candlestick patterns include the following:
- The “Three-Line Strike” pattern shows three consecutive down days, followed by a wide range bar that closes above the high point of the first candle in the series.
- The “Bearish Engulfing” pattern shows a day of gains (i.e., a green or white candle), followed by a day of trading with higher volatility (i.e., a larger candle) that closes down. In this case, the “bearish” candle is larger than the “bullish” candle, thereby engulfing it.
- The “Hanging Man” pattern shows a day of losses represented as a compressed block at the top of a long-tailed shadow. This indicates high volatility around a compressed opening and closing price, which could signal further downward pressure on the stock.
- The “Three Black Crows” pattern is as ominous as it sounds. This formation shows three, large down days that may trigger an even larger downdraft in the trading days to follow.
The “Bullish Abandoned Baby” pattern
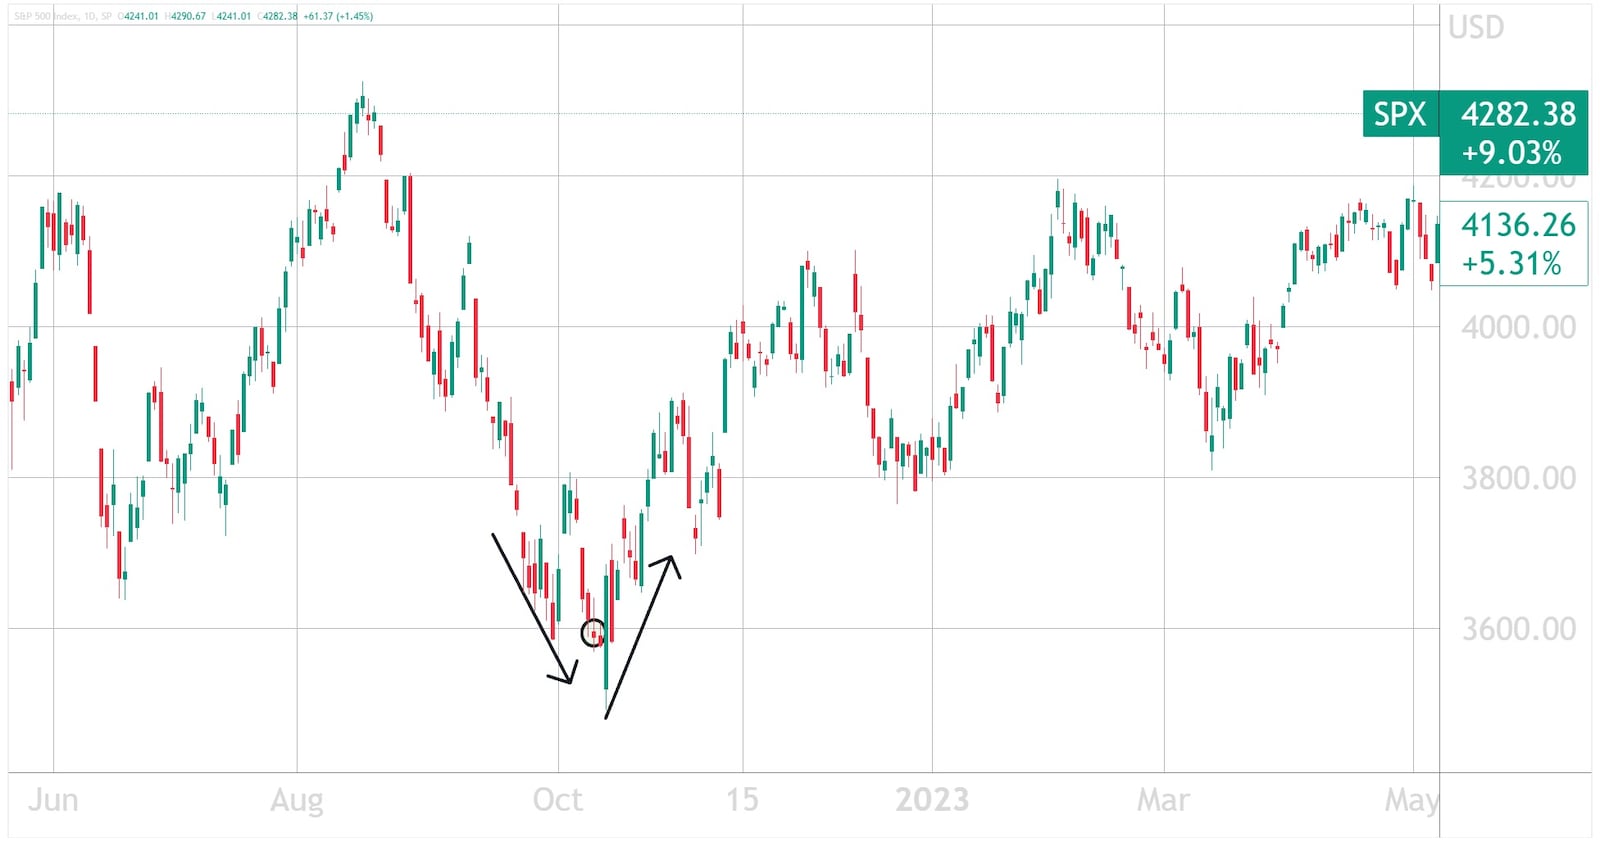
In the chart above, we see an example of the “Bullish Abandoned Baby” pattern. The visual shows a series of down days for the stock, with a significant downtrend followed by three of four trading days in the red. In the middle is a day with a compressed candle – the baby – followed by six consecutive trading days of gains. If a trader looking for this pattern recognizes it, they may be able to earn gains by buying on the days of the “baby” and then selling on the first down day after the stock’s rally. Of course, patterns aren’t necessarily clear as they’re forming, and many of them are analyzed after the fact, limiting their usefulness as a guide for action.
The bottom line
Candlestick patterns are fascinating to study, even if their usefulness is confined mostly to avid traders who frequently draw on technical analysis to make their trading decisions. However, it may not be the best idea to use these patterns to try and time the market – staying invested over the long term historically generates better returns for investors.
Invest your way
Not working with us yet? Find a J.P. Morgan Advisor or explore ways to invest online.