How to read an income statement

- A company’s income statement shows all income and expenses for a certain period.
- The income statement reports how profitable the company was over this period.
- This data can provide insight into a company’s financial strengths and weaknesses and help investors decide where they should put their money.

An income statement lays out the factors that contribute to and detract from a particular company’s profits, which is referred to as “net income” on the statement. Often, investors will review these statements when determining the overall financial health of a company. The formula for net income is: Net income = Revenue − Expenses.
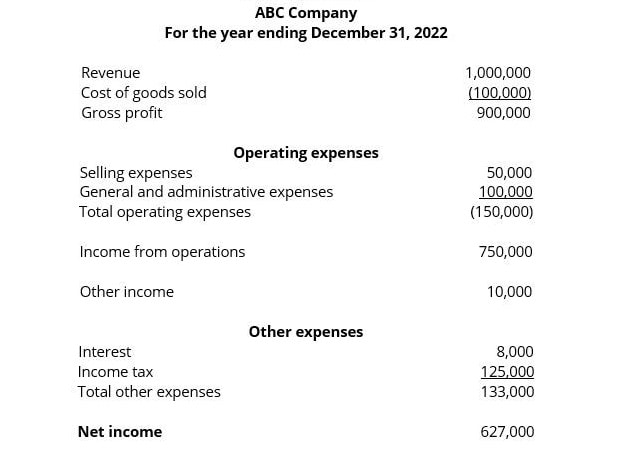
The basic format of an income statement typically looks like this:,
Income Statement
All case studies are shown for illustrative purposes only, and are hypothetical. Any name referenced is fictional, and may not be representative of other individual experiences. Information is not a guarantee of future results.
All publicly traded companies on major U.S. stock exchanges (e.g., Nasdaq, New York Stock Exchange [NYSE], etc.) must submit an income statement to the Securities and Exchange Commission (SEC). Most companies report quarterly and annually, typically presenting what is known as a multiple-step income statement, as shown in the sample income statement. This version separates operating income and expenses from those outside the core business and is considered more detailed than the alternative single-step income statement.
Get up to $1,000
When you open a J.P. Morgan Self-Directed Investing account, you get a trading experience that puts you in control and up to $1,000 in cash bonus.
But what do all these terms mean? Let’s break it down below.
The income statement line-by-line
To fully understand an income statement – and more broadly, a company’s overall financial health – it’s important to know what each term on this statement is referring to:
- Revenue – Listed at the top of an income statement, this denotes how much the company earned over the period in question. Publicly traded companies must report revenue using the accrual method of accounting, which means that revenue is reported when earned. It’s worth noting, however, that this amount may differ from when payment was actually received or made.
- Cost of goods sold – This designates the cost to create the product or service for sale. Subtracting it from revenue gives you the gross profit, which is also known as gross margin.
- Operating expenses – These expenses keep the company running and growing. These may include the salaries of employees, as well as research and marketing costs. Depending on the nature of the company, depreciation is another expense that may be deducted from gross profit. If a company has a plant or equipment that will lose value over time due to wear-and-tear or obsolescence, this loss is spread over a number of years and recorded as an expense.
- Income from operations – This is the number you get once all the relevant expenses are deducted from gross profit. But the company will usually have other secondary income and costs that will affect how much profit is actually earned.
- Other income – Other income may include things like interest earned on corporate cash accounts or proceeds from the sale of equipment. Other expenses include interest paid on debt or payments to settle a lawsuit, as well as taxes.
- Net income – Once these additional line items are tallied and subtracted from income from operations, you get the company’s “bottom line” – or net income.
After the net income or earnings are calculated, the important metric of earnings per share (EPS) can be determined by dividing the profit by the number of shares outstanding. Why is EPS important when analyzing a company’s financial health, though? Generally speaking, companies with higher EPS are more profitable; investors are more likely to purchase a company’s shares if its profits are higher in comparison to its share price.
Vertical and horizontal analysis
Data from a company’s income statement can help identify key drivers of performance, which may help investors see which companies are most financially healthy in comparison to others. Different types of analyses can support these efforts, and two frequently-used methods are vertical and horizontal analysis.
- Vertical analysis – Vertical analysis involves viewing each line item as a percentage of a certain base figure, such as sales or expenses. Doing so can make it easier to see the relative importance of different line categories as you continue down the income statement. It can also reveal answers to questions like, “What is contributing to or detracting the most from profit?” In other words, vertical analysis makes comparing the financial health between companies easier.
- Horizontal analysis – In contrast, horizontal analysis compares data from at least two time periods – often in dollar terms – which may reveal certain financial trends. It can answer questions like whether revenue is increasing or if costs are decreasing. This type of analysis will provide a better idea of a company’s financial health than what can be derived from just a single income statement.
The importance of the income statement
At its core, an income statement answers the question, “Is the company profitable?” It can also indicate how well the company is being managed, as operational efficiencies, cost management and earnings available to shareholders are all revealed within.
The income statement is one of three important financial documents investors study when determining a company’s investment merit; the others are the balance sheet and statement of cash flows. The balance sheet delineates a company’s assets, liabilities and shareholders’ equity, while the statement of cash flows shows how much cash entered and exited throughout a particular accounting period. Together, they can provide a snapshot view of a company’s financial health and its investment prospects.
By analyzing all three financial statements, investors can get a holistic sense of how a company is doing. The information in these statements may help investors decide whether the company’s stock is worth buying, holding or selling.
The bottom line
Income statements are important indicators of a company’s performance over a specific period, and they can be useful resources for investors when evaluating a company’s prospects and investment merit. Contact a J.P. Morgan advisor today to learn how data from income statements can better inform your current investment strategy.
Invest your way
Not working with us yet? Find a J.P. Morgan Advisor or explore ways to invest online.