What is a yield curve and what does it mean?

J.P. Morgan Wealth Management
- The yield curve is a graphic representation of the difference between yields on U.S. Treasuries of various maturities.
- Under normal economic circumstances, the curve slopes upward – short-term bonds provide less yield to investors than longer-term bonds because holding an investment for a longer period involves more risk.
- Inverted yield curves have historically reflected a rising risk of economic recession. Analysts and investors closely watch for this early warning sign.

What is a yield curve?
The yield curve might sound like an inherently complex financial gauge, but the concept is quite simple. The yield curve is a graph that shows the rates that investors can earn on U.S. government bonds, or Treasuries, with different maturity dates.
When you buy a bond, you are essentially loaning money to the issuer – meaning the federal government in the case of Treasuries – in exchange for collecting interest payments over the term of the instrument. The yield curve shows the relationship between the interest rate (or yield) on long-term versus short-term bonds.
In general, investors expect to receive a higher rate if they agree to make a loan for a longer period, as their money is tied up for a longer period. Because of this general expectation, known as the term premium, the yield for a longer-term bond is typically higher than the yield for a shorter-term bond.
Get up to $1,000
When you open a J.P. Morgan Self-Directed Investing account, you get a trading experience that puts you in control and up to $1,000 in cash bonus.
Types of yield curves
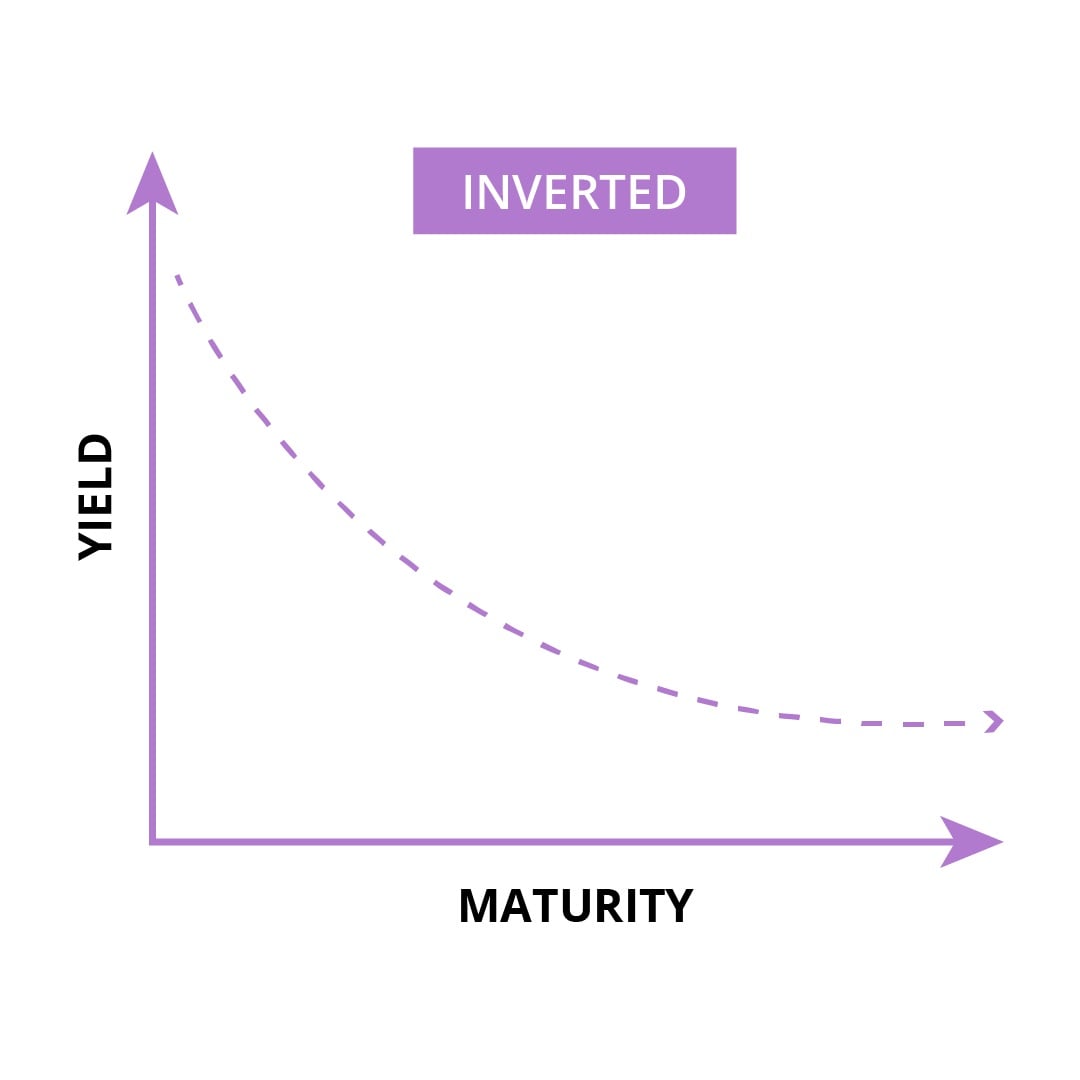
- Inverted: The yield curve inverts when the rate for a longer-term bond is lower than the rate for a shorter-term bond. Why would this happen? When investors are worried about weaker economic growth, they’re more interested in Treasuries that mature many years in the future, as a longer-term investment allows them to lock in the current rate before they might fall lower. These inversions have occurred before all U.S. recessions (and recessions in other countries as well) for the past 50 years, so analysts tend to watch this metric as a potential sign of economic trouble ahead.
Inverted curve chart
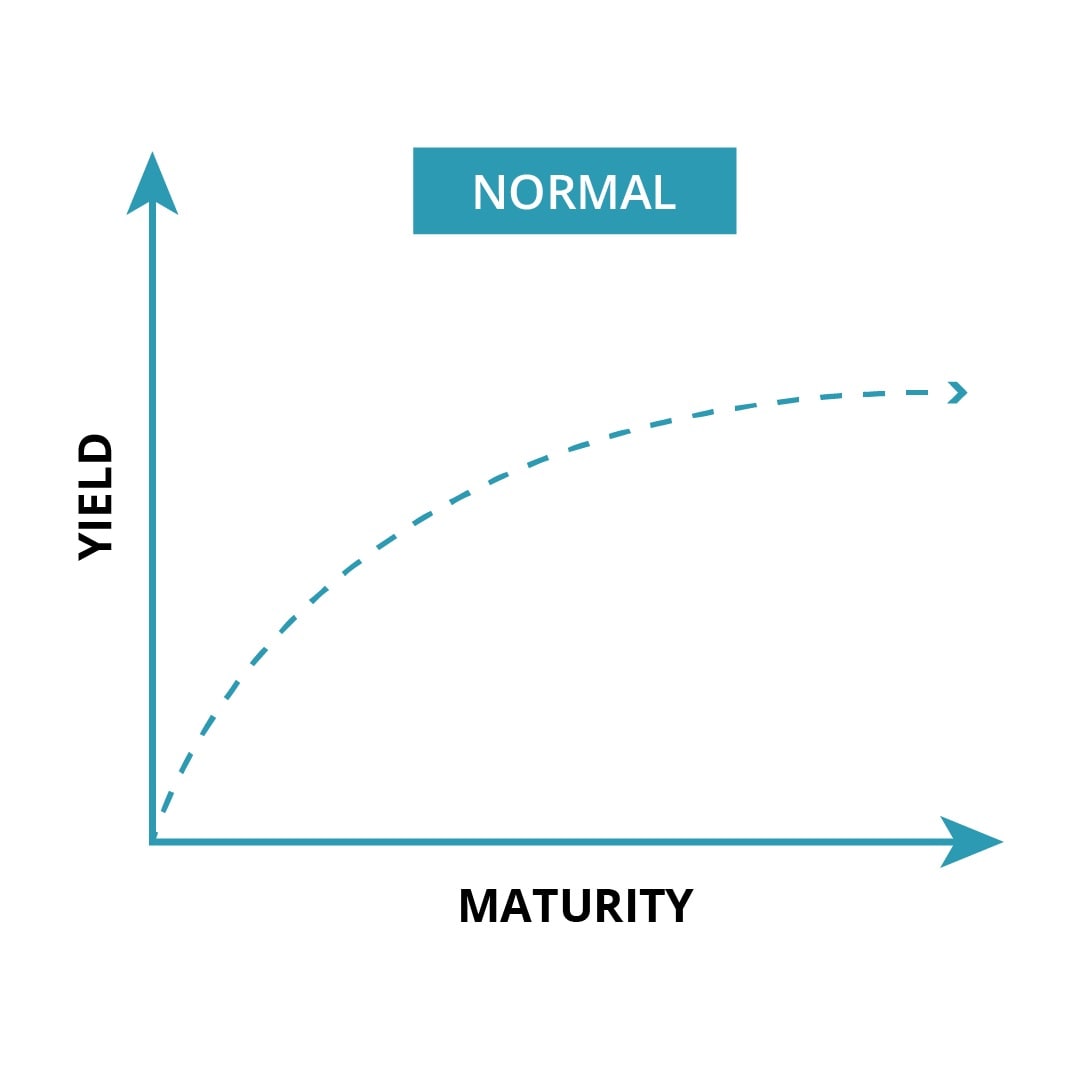
- Normal: Under normal conditions, graphing the yields of Treasuries of increasing maturity results in a left-to-right, upward-sloping curve, meaning interest rates are higher on bonds with longer maturities. This is because lenders and bond investors who commit to tying up their money for longer periods take on more risk, including risk that higher inflation in the future will lower the real expected return from owning longer-dated bonds. Forecasting economic conditions – inflation, monetary policy, the global economy – over a decade is harder than predicting them over the next week or month. Yields change in response to shifting economic conditions, meaning the potential gains and losses on longer-term investments are less certain than those on short-term instruments. When the yield curve is normal, a 10-year Treasury note will have a higher yield than a 2-year note because it has a longer duration (yields move inversely to prices). A normal yield curve implies stable economic conditions and a normal economic cycle.
Normal curve chart
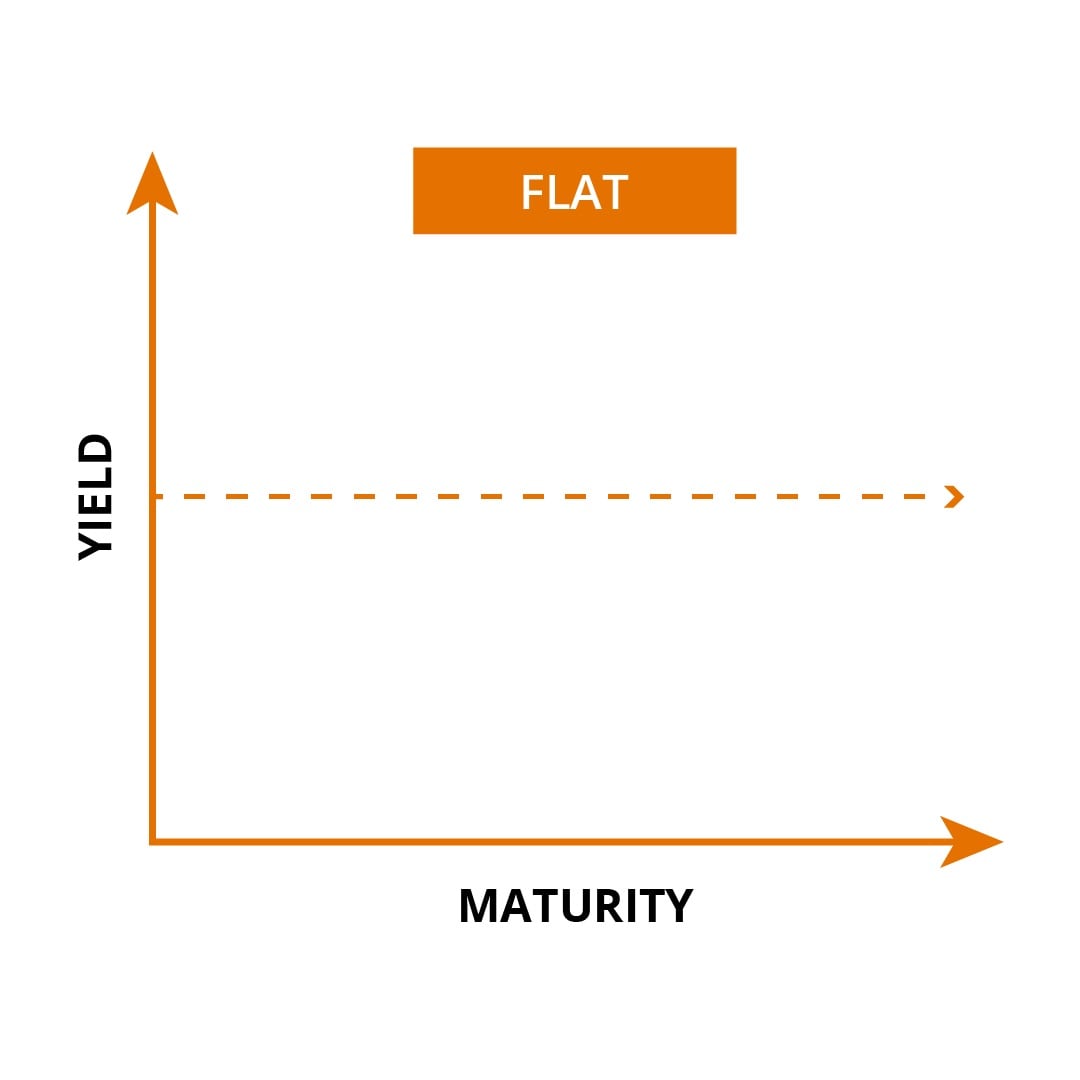
- Flat: A flat yield curve takes the form of a horizontal line, showing that the gap between short- and long-term yields is shrinking. A flatter yield curve can hurt lenders' profits and stability, diminishing their willingness to lend. Investors tend to get nervous when the yield curve flattens because it heightens the risk of an inverted yield curve.
Flat curve chart
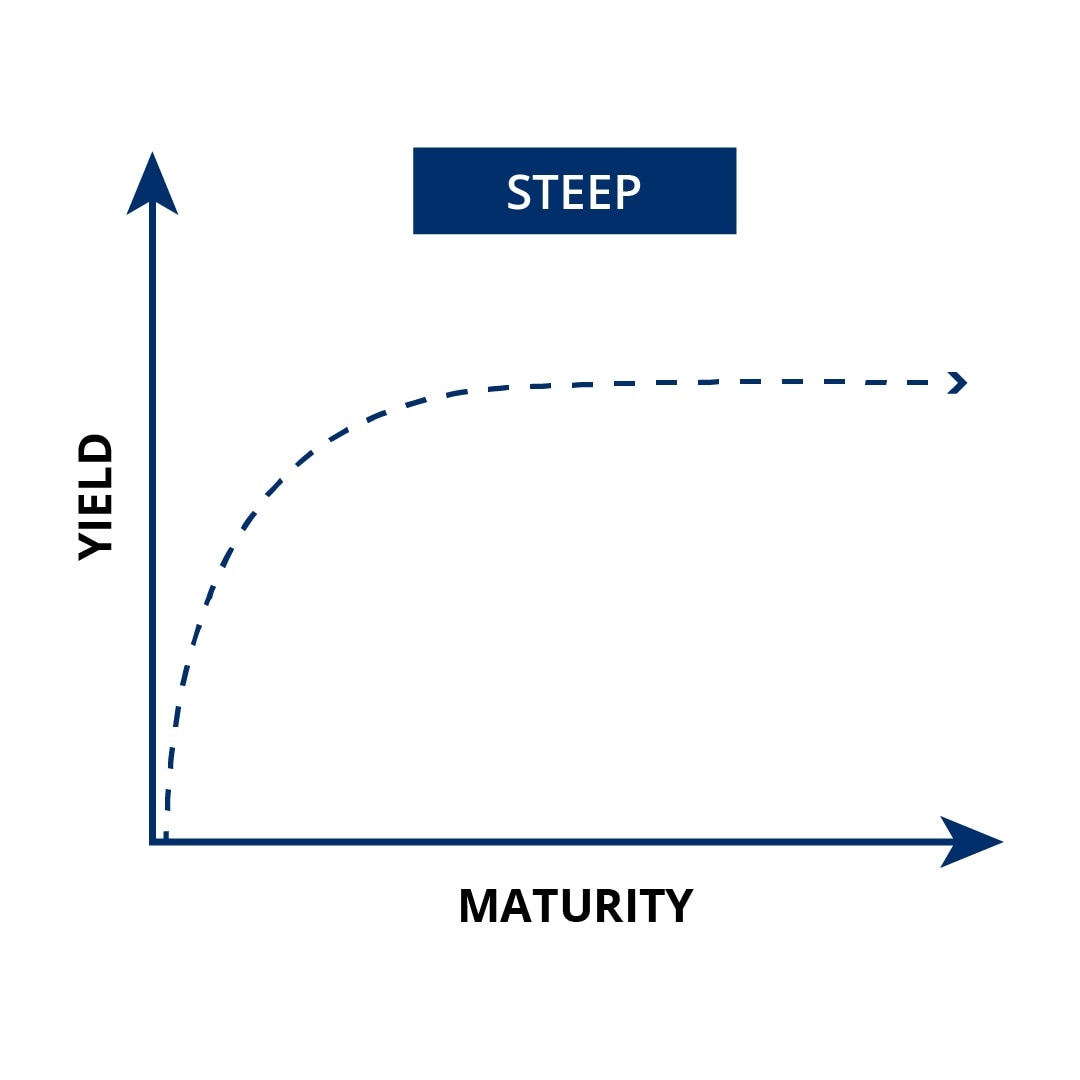
- Steep: A steep curve is one where the difference between short-term and long-term rates increases. Yield curves often steepen during the start of an economic expansion. Historically, when the yield curve steepens, it is after a period of economic weakness, where the Fed depressed short-term rates to stimulate the economy. As the economy begins to grow again, that results in greater demand for capital, leading to higher inflation expectations in the future.
Steep curve chart
What yield curves tell us about the economy
The yield curve plots the yield of all Treasury securities, and investors watch its shape to extrapolate market expectations for U.S. growth and monetary policy.
When the interest rate on long-term bonds is lower than the interest rate on short-term bonds, it’s known as an inverted yield curve, a relatively rare occurrence. This is typically considered a negative sign for the economy.
Changes in yield curves have correlated with every U.S. recession since 1950, making it a reliable (though not infallible) recession indicator (it had one false signal in 1967).
An inverted yield curve implies that, while interest rates are high now, economic growth and inflation will likely be slower in the future.
Most recently, the combination of Federal Reserve increases in the federal-funds target rate in 2022–2023 and the expectation for rates to remain higher for longer lifted short-term Treasury yields above long-term rates. Although the yield curve remained inverted through the end of 2024, no recession has emerged so far in the wake of this most recent inversion.
The bottom line
Investors may use yield curves as an indicator of the market's future. Normal curves – when longer-term yields are higher than short-term yields – have historically correlated with economic expansions. Downward-sloping curves, or inversions – when shorter-term bonds yield more than longer-term bonds – typically correlate with economic recessions.
Frequently asked questions about yield curve
Yield refers to the return on an investment in a bond.
A bond is a type of investment issued by the government or a corporation to raise money. Investors can purchase the bonds, which earn interest. Bonds are a type of debt security, or fixed-income security, and have defined terms between a borrower (the issuer) and a lender (the investor). The investor gets a stream of income – the bond yield – just for holding the investment.
A Treasury yield is the percentage return to the buyer of U.S. Treasury securities or the interest rate at which the government is borrowing money.
Invest your way
Not working with us yet? Find a J.P. Morgan Advisor or explore ways to invest online.
J.P. Morgan Wealth Management